Is Nichirei Corporation's (TSE:2871) Recent Stock Performance Influenced By Its Fundamentals In Any Way?


Nichirei's (TSE:2871) stock is up by a considerable 14% over the past three months. We wonder if and what role the company's financials play in that price change as a company's long-term fundamentals usually dictate market outcomes. In this article, we decided to focus on Nichirei's ROE.
Return on equity or ROE is a key measure used to assess how efficiently a company's management is utilizing the company's capital. Simply put, it is used to assess the profitability of a company in relation to its equity capital.
View our latest analysis for Nichirei
How Do You Calculate Return On Equity?
The formula for return on equity is:
Return on Equity = Net Profit (from continuing operations) ÷ Shareholders' Equity
So, based on the above formula, the ROE for Nichirei is:
10% = JP¥28b ÷ JP¥273b (Based on the trailing twelve months to June 2024).
The 'return' is the yearly profit. So, this means that for every ¥1 of its shareholder's investments, the company generates a profit of ¥0.10.
Why Is ROE Important For Earnings Growth?
We have already established that ROE serves as an efficient profit-generating gauge for a company's future earnings. Based on how much of its profits the company chooses to reinvest or "retain", we are then able to evaluate a company's future ability to generate profits. Assuming all else is equal, companies that have both a higher return on equity and higher profit retention are usually the ones that have a higher growth rate when compared to companies that don't have the same features.
Nichirei's Earnings Growth And 10% ROE
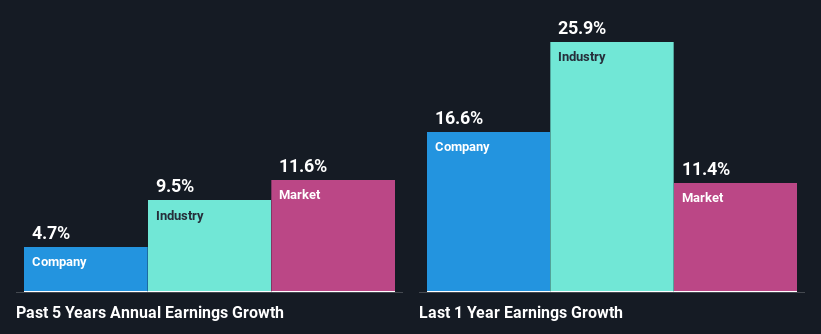
At first glance, Nichirei seems to have a decent ROE. Further, the company's ROE compares quite favorably to the industry average of 7.4%. Despite this, Nichirei's five year net income growth was quite low averaging at only 4.7%. That's a bit unexpected from a company which has such a high rate of return. We reckon that a low growth, when returns are quite high could be the result of certain circumstances like low earnings retention or poor allocation of capital.
We then compared Nichirei's net income growth with the industry and found that the company's growth figure is lower than the average industry growth rate of 9.5% in the same 5-year period, which is a bit concerning.
Earnings growth is an important metric to consider when valuing a stock. The investor should try to establish if the expected growth or decline in earnings, whichever the case may be, is priced in. Doing so will help them establish if the stock's future looks promising or ominous. Is 2871 fairly valued? This infographic on the company's intrinsic value has everything you need to know.
Is Nichirei Efficiently Re-investing Its Profits?
While Nichirei has a decent three-year median payout ratio of 30% (or a retention ratio of 70%), it has seen very little growth in earnings. Therefore, there might be some other reasons to explain the lack in that respect. For example, the business could be in decline.
In addition, Nichirei has been paying dividends over a period of at least ten years suggesting that keeping up dividend payments is way more important to the management even if it comes at the cost of business growth.
Conclusion
In total, it does look like Nichirei has some positive aspects to its business. Although, we are disappointed to see a lack of growth in earnings even in spite of a high ROE and and a high reinvestment rate. We believe that there might be some outside factors that could be having a negative impact on the business. That being so, the latest analyst forecasts show that the company will continue to see an expansion in its earnings. To know more about the company's future earnings growth forecasts take a look at this free report on analyst forecasts for the company to find out more.
Valuation is complex, but we're here to simplify it.
Discover if Nichirei might be undervalued or overvalued with our detailed analysis, featuring fair value estimates, potential risks, dividends, insider trades, and its financial condition.
Access Free AnalysisHave feedback on this article? Concerned about the content? Get in touch with us directly. Alternatively, email editorial-team (at) simplywallst.com.
This article by Simply Wall St is general in nature. We provide commentary based on historical data and analyst forecasts only using an unbiased methodology and our articles are not intended to be financial advice. It does not constitute a recommendation to buy or sell any stock, and does not take account of your objectives, or your financial situation. We aim to bring you long-term focused analysis driven by fundamental data. Note that our analysis may not factor in the latest price-sensitive company announcements or qualitative material. Simply Wall St has no position in any stocks mentioned.
About TSE:2871
Nichirei
Through its subsidiaries, engages in the processed food, marine products, meat and poultry products, temperature-controlled logistics, real estate, and biosciences businesses in Japan and internationally.
Flawless balance sheet with proven track record and pays a dividend.
