Stock Analysis
- Japan
- /
- Capital Markets
- /
- TSE:8604
The 4.3% return this week takes Nomura Holdings' (TSE:8604) shareholders five-year gains to 170%


When you buy a stock there is always a possibility that it could drop 100%. But on the bright side, you can make far more than 100% on a really good stock. One great example is Nomura Holdings, Inc. (TSE:8604) which saw its share price drive 119% higher over five years. Also pleasing for shareholders was the 19% gain in the last three months. This could be related to the recent financial results, released recently - you can catch up on the most recent data by reading our company report.
Since the stock has added JP¥142b to its market cap in the past week alone, let's see if underlying performance has been driving long-term returns.
Check out our latest analysis for Nomura Holdings
While markets are a powerful pricing mechanism, share prices reflect investor sentiment, not just underlying business performance. One imperfect but simple way to consider how the market perception of a company has shifted is to compare the change in the earnings per share (EPS) with the share price movement.
During the five years of share price growth, Nomura Holdings moved from a loss to profitability. Sometimes, the start of profitability is a major inflection point that can signal fast earnings growth to come, which in turn justifies very strong share price gains. Since the company was unprofitable five years ago, but not three years ago, it's worth taking a look at the returns in the last three years, too. We can see that the Nomura Holdings share price is up 56% in the last three years. Meanwhile, EPS is up 3.3% per year. This EPS growth is lower than the 16% average annual increase in the share price over three years. So one can reasonably conclude the market is more enthusiastic about the stock than it was three years ago.
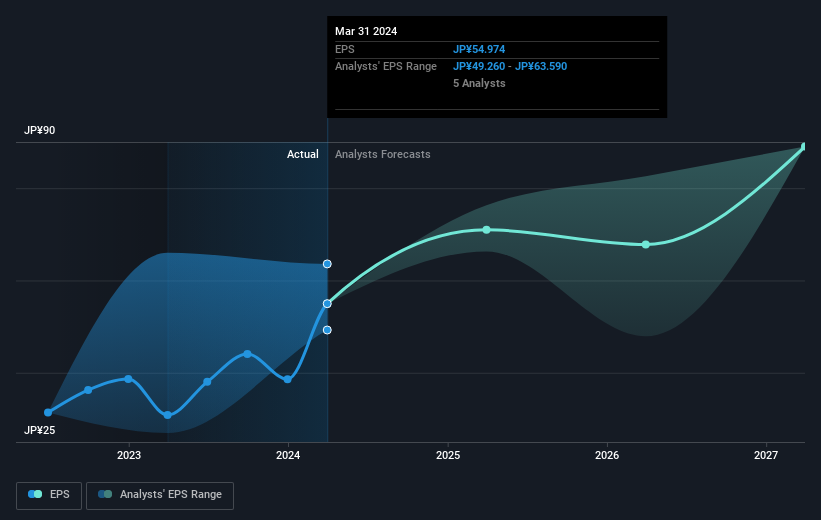
You can see how EPS has changed over time in the image below (click on the chart to see the exact values).
We know that Nomura Holdings has improved its bottom line lately, but is it going to grow revenue? This free report showing analyst revenue forecasts should help you figure out if the EPS growth can be sustained.
What About Dividends?
As well as measuring the share price return, investors should also consider the total shareholder return (TSR). The TSR is a return calculation that accounts for the value of cash dividends (assuming that any dividend received was reinvested) and the calculated value of any discounted capital raisings and spin-offs. So for companies that pay a generous dividend, the TSR is often a lot higher than the share price return. In the case of Nomura Holdings, it has a TSR of 170% for the last 5 years. That exceeds its share price return that we previously mentioned. This is largely a result of its dividend payments!
A Different Perspective
We're pleased to report that Nomura Holdings shareholders have received a total shareholder return of 94% over one year. And that does include the dividend. That's better than the annualised return of 22% over half a decade, implying that the company is doing better recently. In the best case scenario, this may hint at some real business momentum, implying that now could be a great time to delve deeper. While it is well worth considering the different impacts that market conditions can have on the share price, there are other factors that are even more important. Even so, be aware that Nomura Holdings is showing 1 warning sign in our investment analysis , you should know about...
We will like Nomura Holdings better if we see some big insider buys. While we wait, check out this free list of growing companies with considerable, recent, insider buying.
Please note, the market returns quoted in this article reflect the market weighted average returns of stocks that currently trade on Japanese exchanges.
Valuation is complex, but we're helping make it simple.
Find out whether Nomura Holdings is potentially over or undervalued by checking out our comprehensive analysis, which includes fair value estimates, risks and warnings, dividends, insider transactions and financial health.
View the Free AnalysisHave feedback on this article? Concerned about the content? Get in touch with us directly. Alternatively, email editorial-team (at) simplywallst.com.
This article by Simply Wall St is general in nature. We provide commentary based on historical data and analyst forecasts only using an unbiased methodology and our articles are not intended to be financial advice. It does not constitute a recommendation to buy or sell any stock, and does not take account of your objectives, or your financial situation. We aim to bring you long-term focused analysis driven by fundamental data. Note that our analysis may not factor in the latest price-sensitive company announcements or qualitative material. Simply Wall St has no position in any stocks mentioned.
About TSE:8604
Nomura Holdings
Provides various financial services to individuals, corporations, financial institutions, governments, and governmental agencies worldwide.
Solid track record with adequate balance sheet.

