Stock Analysis
- Japan
- /
- Capital Markets
- /
- TSE:4765
SBI Global Asset Management Full Year 2024 Earnings: EPS: JP¥17.72 (vs JP¥60.70 in FY 2023)


SBI Global Asset Management (TSE:4765) Full Year 2024 Results
Key Financial Results
- Revenue: JP¥10.1b (up 16% from FY 2023).
- Net income: JP¥1.59b (down 71% from FY 2023).
- Profit margin: 16% (down from 62% in FY 2023). The decrease in margin was driven by higher expenses.
- EPS: JP¥17.72 (down from JP¥60.70 in FY 2023).
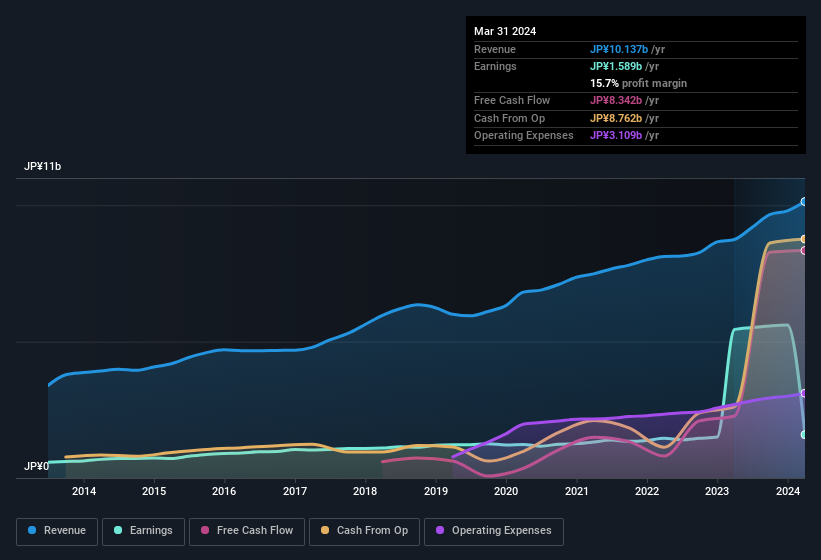
All figures shown in the chart above are for the trailing 12 month (TTM) period
SBI Global Asset Management shares are down 2.7% from a week ago.
Risk Analysis
Be aware that SBI Global Asset Management is showing 1 warning sign in our investment analysis that you should know about...
Valuation is complex, but we're helping make it simple.
Find out whether SBI Global Asset Management is potentially over or undervalued by checking out our comprehensive analysis, which includes fair value estimates, risks and warnings, dividends, insider transactions and financial health.
View the Free AnalysisHave feedback on this article? Concerned about the content? Get in touch with us directly. Alternatively, email editorial-team (at) simplywallst.com.
This article by Simply Wall St is general in nature. We provide commentary based on historical data and analyst forecasts only using an unbiased methodology and our articles are not intended to be financial advice. It does not constitute a recommendation to buy or sell any stock, and does not take account of your objectives, or your financial situation. We aim to bring you long-term focused analysis driven by fundamental data. Note that our analysis may not factor in the latest price-sensitive company announcements or qualitative material. Simply Wall St has no position in any stocks mentioned.
About TSE:4765
SBI Global Asset Management
SBI Global Asset Management Co.,Ltd. provides financial and asset management services in Japan and internationally.
Flawless balance sheet established dividend payer.

