Advertisement
- Japan
- /
- Food and Staples Retail
- /
- TSE:9869
Kato Sangyo (TSE:9869): Evaluating Valuation Following Board-Approved Share Buyback Initiative

Simply Wall St
Reviewed by Simply Wall St
Kato Sangyo (TSE:9869) has announced the purchase of 60,700 shares of its own stock on the Tokyo Stock Exchange. This move fits into a broader share buyback program approved by its Board of Directors.
See our latest analysis for Kato Sangyo.
Kato Sangyo’s recent buyback appears to have come on the heels of a remarkably strong year for the company, with the latest share price sitting at ¥5,990. Not only is momentum building in the short term, but the 49.4% total shareholder return over the past year underlines how the buyback fits an already impressive run. Its 83% total return over three years shows that strong performance has not been a short-lived phenomenon.
If sustained growth and active capital management inspire your curiosity, this is a great opportunity to branch out and discover fast growing stocks with high insider ownership
With such robust returns and a proactive capital strategy already on display, the key question for investors becomes whether Kato Sangyo’s current price offers hidden value or if the market has already anticipated future gains.
Price-to-Earnings of 13x: Is it justified?
Kato Sangyo currently trades at a price-to-earnings (P/E) ratio of 13x, just above the industry average. This suggests the market places a premium on recent performance. At ¥5,990 per share, investors are asked to pay a little more for each unit of earnings than comparable firms in the Japanese Consumer Retailing sector.
The price-to-earnings ratio is a widely used metric that compares a company’s current share price to its per-share earnings. It provides a snapshot of how the market values future profit potential. For companies in the retailing sector, it often reflects perceived growth, durability of earnings, and market sentiment on consumer spending trends.
Looking closely, Kato Sangyo’s P/E of 13x is only slightly more expensive than the industry median of 12.8x. This small premium implies optimism about continued operational strength, especially following a string of robust shareholder returns and steady profit growth. Still, relative to its peer group, the difference is modest, suggesting the valuation is not excessively stretched. Since the peer average P/E stands at an even higher 15.9x, the company is actually cheaper on that measure.
See what the numbers say about this price — find out in our valuation breakdown.
Result: Price-to-Earnings of 13x (ABOUT RIGHT)
However, investors should remain mindful of possible sector headwinds or unexpected earnings volatility, as these factors could swiftly shift sentiment around Kato Sangyo’s valuation.
Find out about the key risks to this Kato Sangyo narrative.
Another View: Discounted Cash Flow Perspective
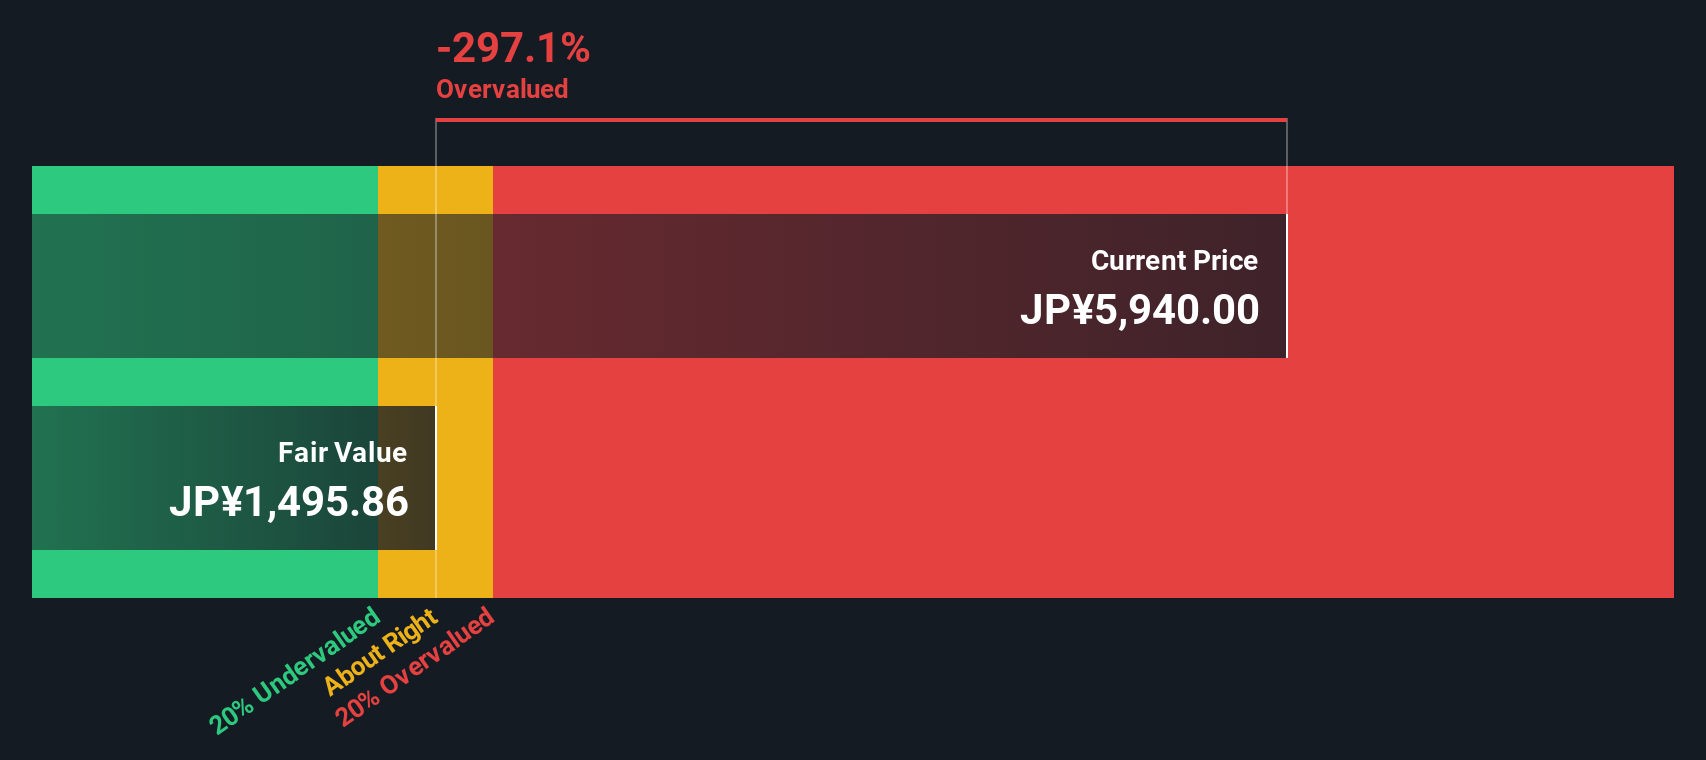
While Kato Sangyo appears fairly valued based on its price-to-earnings ratio, our DCF model suggests a different picture. The SWS DCF model estimates fair value at ¥1,512.51, which is well below the current share price. This result may prompt questions about how much future growth is already reflected in the valuation.
Look into how the SWS DCF model arrives at its fair value.
Simply Wall St performs a discounted cash flow (DCF) on every stock in the world every day (check out Kato Sangyo for example). We show the entire calculation in full. You can track the result in your watchlist or portfolio and be alerted when this changes, or use our stock screener to discover 870 undervalued stocks based on their cash flows. If you save a screener we even alert you when new companies match - so you never miss a potential opportunity.
Build Your Own Kato Sangyo Narrative
If you think the story here could be told differently or want to dive deeper into the figures, you can create a fresh perspective in just a few minutes by using Do it your way.
A great starting point for your Kato Sangyo research is our analysis highlighting 2 key rewards and 1 important warning sign that could impact your investment decision.
Looking for More Compelling Opportunities?
Don't settle for just one win. Expand your investing toolkit with smarter opportunities that could transform your portfolio’s growth potential.
- Tap into market-shaking innovation with these 24 AI penny stocks powering breakthroughs in artificial intelligence across diverse industries.
- Boost your income stream by reviewing these 16 dividend stocks with yields > 3% featuring companies with consistently attractive yields above 3%.
- Seize rare value plays using these 870 undervalued stocks based on cash flows where strong fundamentals signal potential upside others may be missing.
This article by Simply Wall St is general in nature. We provide commentary based on historical data and analyst forecasts only using an unbiased methodology and our articles are not intended to be financial advice. It does not constitute a recommendation to buy or sell any stock, and does not take account of your objectives, or your financial situation. We aim to bring you long-term focused analysis driven by fundamental data. Note that our analysis may not factor in the latest price-sensitive company announcements or qualitative material. Simply Wall St has no position in any stocks mentioned.
Valuation is complex, but we're here to simplify it.
Discover if Kato Sangyo might be undervalued or overvalued with our detailed analysis, featuring fair value estimates, potential risks, dividends, insider trades, and its financial condition.
Access Free AnalysisHave feedback on this article? Concerned about the content? Get in touch with us directly. Alternatively, email editorial-team@simplywallst.com
About TSE:9869
Kato Sangyo
Engages in the general food wholesaling business in Japan and internationally.
Excellent balance sheet with proven track record and pays a dividend.
Market Insights

Advertisement
Community Narratives
The company that turned a verb into a global necessity and basically runs the modern internet, digital ads, smartphones, maps, and AI.
Fair Value US$300.00|7.1% undervalued
OS
Community Contributor
Flowers Foods Pays A Fair Price For Health
Fair Value US$16.12|26.4% undervalued
NV
Community Contributor
TMX Group will thrive with 33.3% profit margin and enduring market moat
Fair Value CA$49.90|0.8% overvalued
LI
Community Contributor
The "Molecular Pencil": Why Beam's Technology is Built to Win
Fair Value US$65.01|65.8% undervalued
DA
Community Contributor