- Japan
- /
- Food and Staples Retail
- /
- TSE:2791
Daikokutenbussan Co.,Ltd.'s (TSE:2791) Stock's On An Uptrend: Are Strong Financials Guiding The Market?


Most readers would already be aware that DaikokutenbussanLtd's (TSE:2791) stock increased significantly by 27% over the past three months. Given the company's impressive performance, we decided to study its financial indicators more closely as a company's financial health over the long-term usually dictates market outcomes. Specifically, we decided to study DaikokutenbussanLtd's ROE in this article.
ROE or return on equity is a useful tool to assess how effectively a company can generate returns on the investment it received from its shareholders. In short, ROE shows the profit each dollar generates with respect to its shareholder investments.
View our latest analysis for DaikokutenbussanLtd
How Do You Calculate Return On Equity?
ROE can be calculated by using the formula:
Return on Equity = Net Profit (from continuing operations) ÷ Shareholders' Equity
So, based on the above formula, the ROE for DaikokutenbussanLtd is:
11% = JP¥6.3b ÷ JP¥55b (Based on the trailing twelve months to May 2024).
The 'return' is the profit over the last twelve months. One way to conceptualize this is that for each ¥1 of shareholders' capital it has, the company made ¥0.11 in profit.
Why Is ROE Important For Earnings Growth?
We have already established that ROE serves as an efficient profit-generating gauge for a company's future earnings. Based on how much of its profits the company chooses to reinvest or "retain", we are then able to evaluate a company's future ability to generate profits. Assuming everything else remains unchanged, the higher the ROE and profit retention, the higher the growth rate of a company compared to companies that don't necessarily bear these characteristics.
DaikokutenbussanLtd's Earnings Growth And 11% ROE
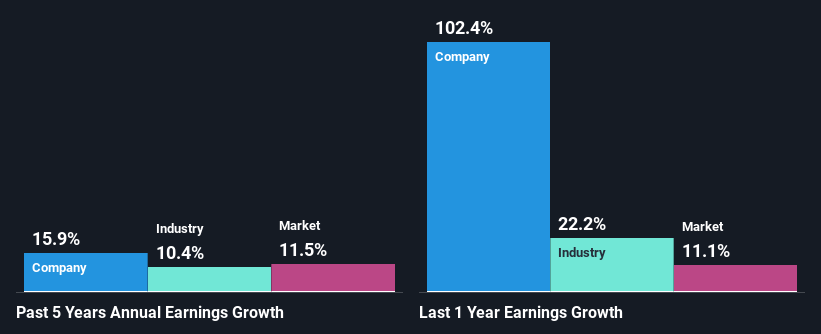
To start with, DaikokutenbussanLtd's ROE looks acceptable. Further, the company's ROE compares quite favorably to the industry average of 9.3%. This certainly adds some context to DaikokutenbussanLtd's decent 16% net income growth seen over the past five years.
As a next step, we compared DaikokutenbussanLtd's net income growth with the industry, and pleasingly, we found that the growth seen by the company is higher than the average industry growth of 10%.
The basis for attaching value to a company is, to a great extent, tied to its earnings growth. What investors need to determine next is if the expected earnings growth, or the lack of it, is already built into the share price. Doing so will help them establish if the stock's future looks promising or ominous. One good indicator of expected earnings growth is the P/E ratio which determines the price the market is willing to pay for a stock based on its earnings prospects. So, you may want to check if DaikokutenbussanLtd is trading on a high P/E or a low P/E, relative to its industry.
Is DaikokutenbussanLtd Efficiently Re-investing Its Profits?
DaikokutenbussanLtd's three-year median payout ratio to shareholders is 8.0% (implying that it retains 92% of its income), which is on the lower side, so it seems like the management is reinvesting profits heavily to grow its business.
Additionally, DaikokutenbussanLtd has paid dividends over a period of at least ten years which means that the company is pretty serious about sharing its profits with shareholders.
Conclusion
Overall, we are quite pleased with DaikokutenbussanLtd's performance. Particularly, we like that the company is reinvesting heavily into its business, and at a high rate of return. Unsurprisingly, this has led to an impressive earnings growth.
New: Manage All Your Stock Portfolios in One Place
We've created the ultimate portfolio companion for stock investors, and it's free.
• Connect an unlimited number of Portfolios and see your total in one currency
• Be alerted to new Warning Signs or Risks via email or mobile
• Track the Fair Value of your stocks
Have feedback on this article? Concerned about the content? Get in touch with us directly. Alternatively, email editorial-team (at) simplywallst.com.
This article by Simply Wall St is general in nature. We provide commentary based on historical data and analyst forecasts only using an unbiased methodology and our articles are not intended to be financial advice. It does not constitute a recommendation to buy or sell any stock, and does not take account of your objectives, or your financial situation. We aim to bring you long-term focused analysis driven by fundamental data. Note that our analysis may not factor in the latest price-sensitive company announcements or qualitative material. Simply Wall St has no position in any stocks mentioned.
About TSE:2791
Solid track record with excellent balance sheet.
Market Insights

Community Narratives
