Stock Analysis
Samantha Thavasa Japan Limited's (TSE:7829) 29% Cheaper Price Remains In Tune With Revenues


The Samantha Thavasa Japan Limited (TSE:7829) share price has softened a substantial 29% over the previous 30 days, handing back much of the gains the stock has made lately. Longer-term shareholders would now have taken a real hit with the stock declining 2.2% in the last year.
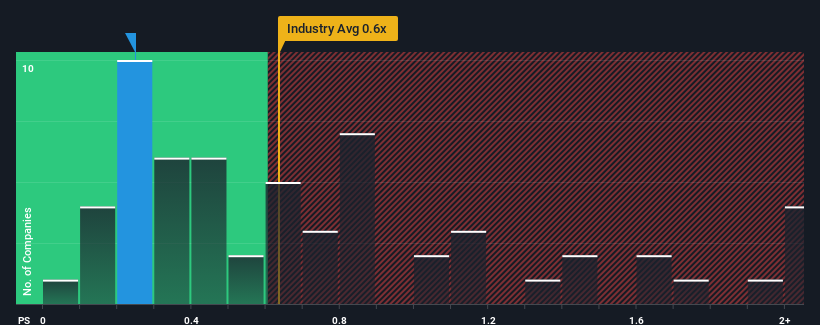
In spite of the heavy fall in price, it's still not a stretch to say that Samantha Thavasa Japan's price-to-sales (or "P/S") ratio of 0.2x right now seems quite "middle-of-the-road" compared to the Luxury industry in Japan, where the median P/S ratio is around 0.6x. While this might not raise any eyebrows, if the P/S ratio is not justified investors could be missing out on a potential opportunity or ignoring looming disappointment.
See our latest analysis for Samantha Thavasa Japan
What Does Samantha Thavasa Japan's P/S Mean For Shareholders?
For instance, Samantha Thavasa Japan's receding revenue in recent times would have to be some food for thought. Perhaps investors believe the recent revenue performance is enough to keep in line with the industry, which is keeping the P/S from dropping off. If you like the company, you'd at least be hoping this is the case so that you could potentially pick up some stock while it's not quite in favour.
Want the full picture on earnings, revenue and cash flow for the company? Then our free report on Samantha Thavasa Japan will help you shine a light on its historical performance.How Is Samantha Thavasa Japan's Revenue Growth Trending?
The only time you'd be comfortable seeing a P/S like Samantha Thavasa Japan's is when the company's growth is tracking the industry closely.
Taking a look back first, the company's revenue growth last year wasn't something to get excited about as it posted a disappointing decline of 8.4%. This has soured the latest three-year period, which nevertheless managed to deliver a decent 14% overall rise in revenue. Accordingly, while they would have preferred to keep the run going, shareholders would be roughly satisfied with the medium-term rates of revenue growth.
Comparing that to the industry, which is predicted to deliver 6.1% growth in the next 12 months, the company's momentum is pretty similar based on recent medium-term annualised revenue results.
With this in consideration, it's clear to see why Samantha Thavasa Japan's P/S matches up closely to its industry peers. Apparently shareholders are comfortable to simply hold on assuming the company will continue keeping a low profile.
The Key Takeaway
Following Samantha Thavasa Japan's share price tumble, its P/S is just clinging on to the industry median P/S. It's argued the price-to-sales ratio is an inferior measure of value within certain industries, but it can be a powerful business sentiment indicator.
It appears to us that Samantha Thavasa Japan maintains its moderate P/S off the back of its recent three-year growth being in line with the wider industry forecast. Right now shareholders are comfortable with the P/S as they are quite confident future revenue won't throw up any surprises. If recent medium-term revenue trends continue, it's hard to see the share price moving strongly in either direction in the near future under these circumstances.
Having said that, be aware Samantha Thavasa Japan is showing 3 warning signs in our investment analysis, and 2 of those make us uncomfortable.
It's important to make sure you look for a great company, not just the first idea you come across. So if growing profitability aligns with your idea of a great company, take a peek at this free list of interesting companies with strong recent earnings growth (and a low P/E).
Valuation is complex, but we're helping make it simple.
Find out whether Samantha Thavasa Japan is potentially over or undervalued by checking out our comprehensive analysis, which includes fair value estimates, risks and warnings, dividends, insider transactions and financial health.
View the Free AnalysisHave feedback on this article? Concerned about the content? Get in touch with us directly. Alternatively, email editorial-team (at) simplywallst.com.
This article by Simply Wall St is general in nature. We provide commentary based on historical data and analyst forecasts only using an unbiased methodology and our articles are not intended to be financial advice. It does not constitute a recommendation to buy or sell any stock, and does not take account of your objectives, or your financial situation. We aim to bring you long-term focused analysis driven by fundamental data. Note that our analysis may not factor in the latest price-sensitive company announcements or qualitative material. Simply Wall St has no position in any stocks mentioned.
About TSE:7829
Samantha Thavasa Japan
Samantha Thavasa Japan Limited plans, manufactures, and sells handbags and jewelry in Japan and internationally.
Mediocre balance sheet and slightly overvalued.
