- Japan
- /
- Commercial Services
- /
- TSE:9735
Investors in SECOM (TSE:9735) have seen notable returns of 35% over the past three years


Buying a low-cost index fund will get you the average market return. But across the board there are plenty of stocks that underperform the market. Unfortunately for shareholders, while the SECOM CO., LTD. (TSE:9735) share price is up 27% in the last three years, that falls short of the market return. In the last year the stock has gained 5.7%.
Let's take a look at the underlying fundamentals over the longer term, and see if they've been consistent with shareholders returns.
See our latest analysis for SECOM
There is no denying that markets are sometimes efficient, but prices do not always reflect underlying business performance. One imperfect but simple way to consider how the market perception of a company has shifted is to compare the change in the earnings per share (EPS) with the share price movement.
During three years of share price growth, SECOM achieved compound earnings per share growth of 9.8% per year. We don't think it is entirely coincidental that the EPS growth is reasonably close to the 8% average annual increase in the share price. That suggests that the market sentiment around the company hasn't changed much over that time. Rather, the share price has approximately tracked EPS growth.
You can see below how EPS has changed over time (discover the exact values by clicking on the image).
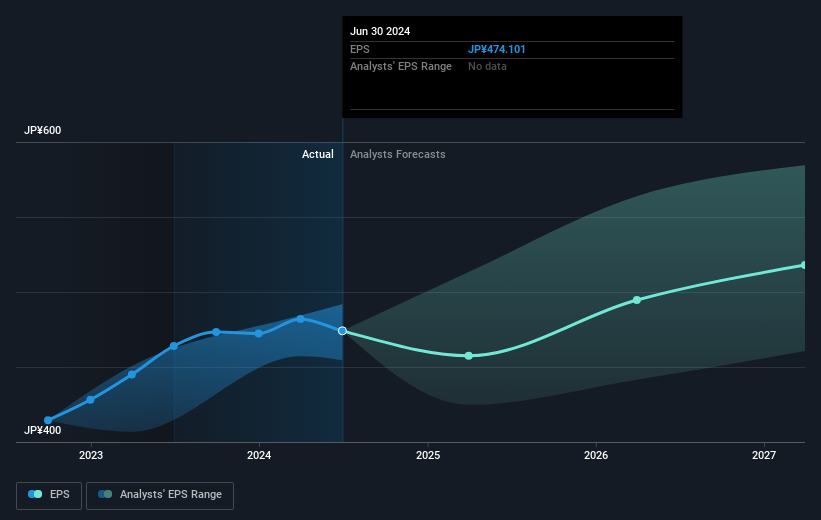
Dive deeper into SECOM's key metrics by checking this interactive graph of SECOM's earnings, revenue and cash flow.
What About Dividends?
It is important to consider the total shareholder return, as well as the share price return, for any given stock. The TSR is a return calculation that accounts for the value of cash dividends (assuming that any dividend received was reinvested) and the calculated value of any discounted capital raisings and spin-offs. It's fair to say that the TSR gives a more complete picture for stocks that pay a dividend. We note that for SECOM the TSR over the last 3 years was 35%, which is better than the share price return mentioned above. This is largely a result of its dividend payments!
A Different Perspective
SECOM provided a TSR of 7.6% over the last twelve months. But that return falls short of the market. On the bright side, that's still a gain, and it's actually better than the average return of 5% over half a decade This suggests the company might be improving over time. Before forming an opinion on SECOM you might want to consider these 3 valuation metrics.
If you like to buy stocks alongside management, then you might just love this free list of companies. (Hint: many of them are unnoticed AND have attractive valuation).
Please note, the market returns quoted in this article reflect the market weighted average returns of stocks that currently trade on Japanese exchanges.
New: Manage All Your Stock Portfolios in One Place
We've created the ultimate portfolio companion for stock investors, and it's free.
• Connect an unlimited number of Portfolios and see your total in one currency
• Be alerted to new Warning Signs or Risks via email or mobile
• Track the Fair Value of your stocks
Have feedback on this article? Concerned about the content? Get in touch with us directly. Alternatively, email editorial-team (at) simplywallst.com.
This article by Simply Wall St is general in nature. We provide commentary based on historical data and analyst forecasts only using an unbiased methodology and our articles are not intended to be financial advice. It does not constitute a recommendation to buy or sell any stock, and does not take account of your objectives, or your financial situation. We aim to bring you long-term focused analysis driven by fundamental data. Note that our analysis may not factor in the latest price-sensitive company announcements or qualitative material. Simply Wall St has no position in any stocks mentioned.
About TSE:9735
Flawless balance sheet established dividend payer.
