- Japan
- /
- Commercial Services
- /
- TSE:6044
Could The Market Be Wrong About Sanki Service Corporation (TSE:6044) Given Its Attractive Financial Prospects?


It is hard to get excited after looking at Sanki Service's (TSE:6044) recent performance, when its stock has declined 26% over the past three months. However, stock prices are usually driven by a company’s financial performance over the long term, which in this case looks quite promising. Specifically, we decided to study Sanki Service's ROE in this article.
Return on equity or ROE is an important factor to be considered by a shareholder because it tells them how effectively their capital is being reinvested. Simply put, it is used to assess the profitability of a company in relation to its equity capital.
Check out our latest analysis for Sanki Service
How Is ROE Calculated?
The formula for return on equity is:
Return on Equity = Net Profit (from continuing operations) ÷ Shareholders' Equity
So, based on the above formula, the ROE for Sanki Service is:
11% = JP¥467m ÷ JP¥4.2b (Based on the trailing twelve months to May 2024).
The 'return' is the yearly profit. So, this means that for every ¥1 of its shareholder's investments, the company generates a profit of ¥0.11.
What Has ROE Got To Do With Earnings Growth?
We have already established that ROE serves as an efficient profit-generating gauge for a company's future earnings. We now need to evaluate how much profit the company reinvests or "retains" for future growth which then gives us an idea about the growth potential of the company. Generally speaking, other things being equal, firms with a high return on equity and profit retention, have a higher growth rate than firms that don’t share these attributes.
Sanki Service's Earnings Growth And 11% ROE
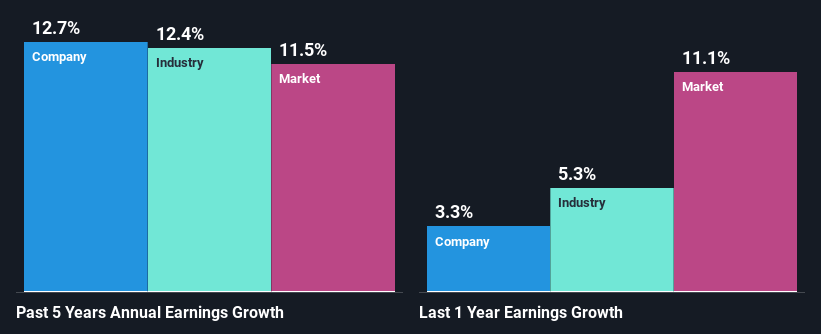
To begin with, Sanki Service seems to have a respectable ROE. Further, the company's ROE compares quite favorably to the industry average of 8.6%. Probably as a result of this, Sanki Service was able to see a decent growth of 13% over the last five years.
As a next step, we compared Sanki Service's net income growth with the industry and found that the company has a similar growth figure when compared with the industry average growth rate of 12% in the same period.
Earnings growth is an important metric to consider when valuing a stock. What investors need to determine next is if the expected earnings growth, or the lack of it, is already built into the share price. By doing so, they will have an idea if the stock is headed into clear blue waters or if swampy waters await. Is Sanki Service fairly valued compared to other companies? These 3 valuation measures might help you decide.
Is Sanki Service Making Efficient Use Of Its Profits?
Sanki Service has a significant three-year median payout ratio of 51%, meaning that it is left with only 49% to reinvest into its business. This implies that the company has been able to achieve decent earnings growth despite returning most of its profits to shareholders.
Moreover, Sanki Service is determined to keep sharing its profits with shareholders which we infer from its long history of nine years of paying a dividend.
Summary
In total, we are pretty happy with Sanki Service's performance. Especially the high ROE, Which has contributed to the impressive growth seen in earnings. Despite the company reinvesting only a small portion of its profits, it still has managed to grow its earnings so that is appreciable. So far, we've only made a quick discussion around the company's earnings growth. You can do your own research on Sanki Service and see how it has performed in the past by looking at this FREE detailed graph of past earnings, revenue and cash flows.
New: Manage All Your Stock Portfolios in One Place
We've created the ultimate portfolio companion for stock investors, and it's free.
• Connect an unlimited number of Portfolios and see your total in one currency
• Be alerted to new Warning Signs or Risks via email or mobile
• Track the Fair Value of your stocks
Have feedback on this article? Concerned about the content? Get in touch with us directly. Alternatively, email editorial-team (at) simplywallst.com.
This article by Simply Wall St is general in nature. We provide commentary based on historical data and analyst forecasts only using an unbiased methodology and our articles are not intended to be financial advice. It does not constitute a recommendation to buy or sell any stock, and does not take account of your objectives, or your financial situation. We aim to bring you long-term focused analysis driven by fundamental data. Note that our analysis may not factor in the latest price-sensitive company announcements or qualitative material. Simply Wall St has no position in any stocks mentioned.
About TSE:6044
Sanki Service
Engages in the provision of design, construction, management, and maintenance services for various equipment in Japan and internationally.
Excellent balance sheet and fair value.
