Advertisement
MISUMI Group (TSE:9962) Valuation Spotlight After Completing Share Buyback Program

Simply Wall St
Reviewed by Kshitija Bhandaru
MISUMI Group (TSE:9962) has just completed its previously announced share buyback, repurchasing over 3 million shares or 1.11% of its outstanding stock between July and September 2025. This completes a significant capital allocation decision for the company.
See our latest analysis for MISUMI Group.
MISUMI Group’s recent buyback comes as the stock has mostly traded sideways over the past year, with a 1-year total shareholder return of -0.09% and only mild movement in the share price. That said, the company’s longer-term returns have also been muted, hinting that some investors are waiting to see whether these recent capital moves can spark renewed momentum.
If corporate actions like share buybacks pique your interest, this could be a great moment to broaden your search and discover fast growing stocks with high insider ownership
With the buyback now finished and shares trading at a meaningful discount to some analyst targets, the key question is whether MISUMI Group is undervalued at current levels or if the market has already accounted for any future growth in its pricing.
Price-to-Earnings of 18.4x: Is it justified?
With a price-to-earnings ratio of 18.4x, MISUMI Group trades below the peer average of 23.2x. This suggests the market is pricing it more attractively than many comparable companies. The most recent closing price was ¥2,313.5, making it look undervalued by this standard.
The price-to-earnings ratio reflects how much investors are willing to pay today for a company's earnings. For a manufacturer like MISUMI Group, this is a key way to gauge whether the market expects ongoing profitability and future growth in line with broader industry expectations.
For MISUMI Group, this multiple is notably lower than both its peer group and the estimated fair ratio of 20.7x. This disparity shows that the stock may have room to catch up if the company's fundamentals continue to impress. The fair ratio highlights the level the market could move toward should optimism on earnings materialize.
Explore the SWS fair ratio for MISUMI Group
Result: Price-to-Earnings of 18.4x (UNDERVALUED)
However, risks remain, including muted long-term returns and recent periods of negative shareholder performance. These factors could weigh on near-term optimism around MISUMI Group.
Find out about the key risks to this MISUMI Group narrative.
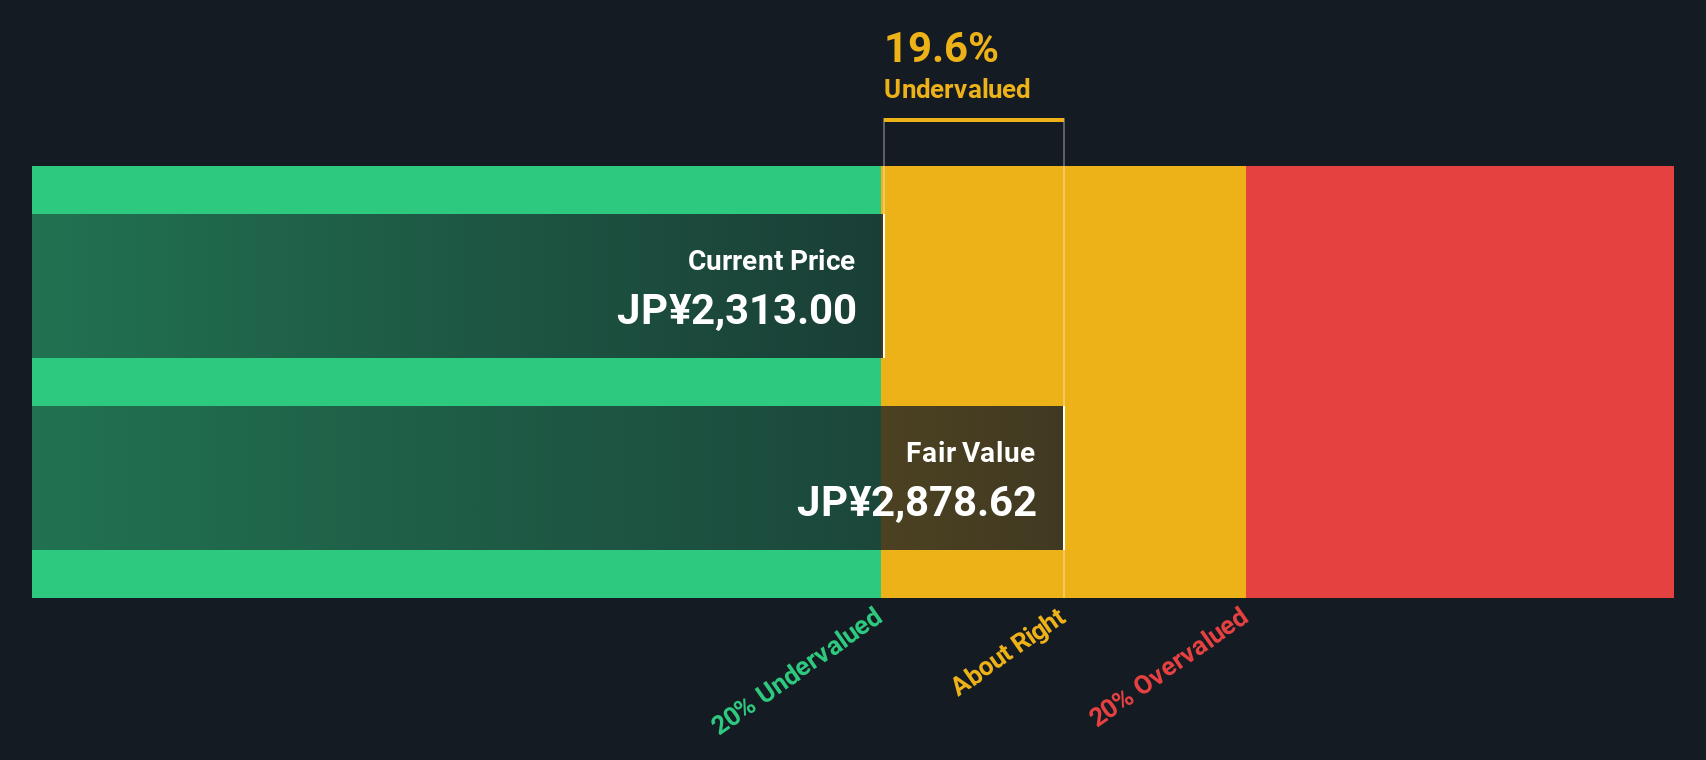
Another View: What Does the SWS DCF Model Reveal?
While the price-to-earnings ratio suggests MISUMI Group is undervalued compared to peers and its own fair ratio, the SWS DCF model offers a different perspective. According to our DCF model, the shares are trading at a 21% discount to estimated fair value, which could indicate even greater potential upside if market sentiment shifts. But how reliable is this more optimistic outlook?
Look into how the SWS DCF model arrives at its fair value.
Simply Wall St performs a discounted cash flow (DCF) on every stock in the world every day (check out MISUMI Group for example). We show the entire calculation in full. You can track the result in your watchlist or portfolio and be alerted when this changes, or use our stock screener to discover undervalued stocks based on their cash flows. If you save a screener we even alert you when new companies match - so you never miss a potential opportunity.
Build Your Own MISUMI Group Narrative
If you have a different perspective or want to investigate the numbers yourself, you can easily build your own view of the story in just a few minutes, Do it your way
A good starting point is our analysis highlighting 3 key rewards investors are optimistic about regarding MISUMI Group.
Looking for More Investment Ideas?
Don’t settle for ordinary returns. Tap into carefully curated stock opportunities that are already attracting savvy investors, and position your portfolio for tomorrow’s biggest moves.
- Boost your income potential and see which companies are rewarding investors most through these 19 dividend stocks with yields > 3% with impressive yields and a history of solid payouts.
- Ride the wave of technological innovation by reviewing these 24 AI penny stocks that are pioneering AI solutions and disrupting traditional industries right now.
- Strengthen your strategy by checking out these 896 undervalued stocks based on cash flows which may offer significant upside based on strong cash flow fundamentals and attractive valuations.
This article by Simply Wall St is general in nature. We provide commentary based on historical data and analyst forecasts only using an unbiased methodology and our articles are not intended to be financial advice. It does not constitute a recommendation to buy or sell any stock, and does not take account of your objectives, or your financial situation. We aim to bring you long-term focused analysis driven by fundamental data. Note that our analysis may not factor in the latest price-sensitive company announcements or qualitative material. Simply Wall St has no position in any stocks mentioned.
New: Manage All Your Stock Portfolios in One Place
We've created the ultimate portfolio companion for stock investors, and it's free.
• Connect an unlimited number of Portfolios and see your total in one currency
• Be alerted to new Warning Signs or Risks via email or mobile
• Track the Fair Value of your stocks
Have feedback on this article? Concerned about the content? Get in touch with us directly. Alternatively, email editorial-team@simplywallst.com
About TSE:9962
MISUMI Group
Engages in the factory automation, die components, and VONA businesses in Japan, China, rest of Asia, the United States, Europe, and internationally.
Flawless balance sheet, undervalued and pays a dividend.
Similar Companies
Market Insights

Advertisement
Community Narratives
The company that turned a verb into a global necessity and basically runs the modern internet, digital ads, smartphones, maps, and AI.
Fair Value US$300.00|7.1% undervalued
OS
Community Contributor
Flowers Foods Pays A Fair Price For Health
Fair Value US$16.12|26.4% undervalued
NV
Community Contributor
TMX Group will thrive with 33.3% profit margin and enduring market moat
Fair Value CA$49.90|0.8% overvalued
LI
Community Contributor
The "Molecular Pencil": Why Beam's Technology is Built to Win
Fair Value US$65.01|65.8% undervalued
DA
Community Contributor