Advertisement
MISUMI Group (TSE:9962) Margin Dip Challenges Bullish Narratives Despite Strong Earnings Growth Guidance

Simply Wall St
Reviewed by Simply Wall St
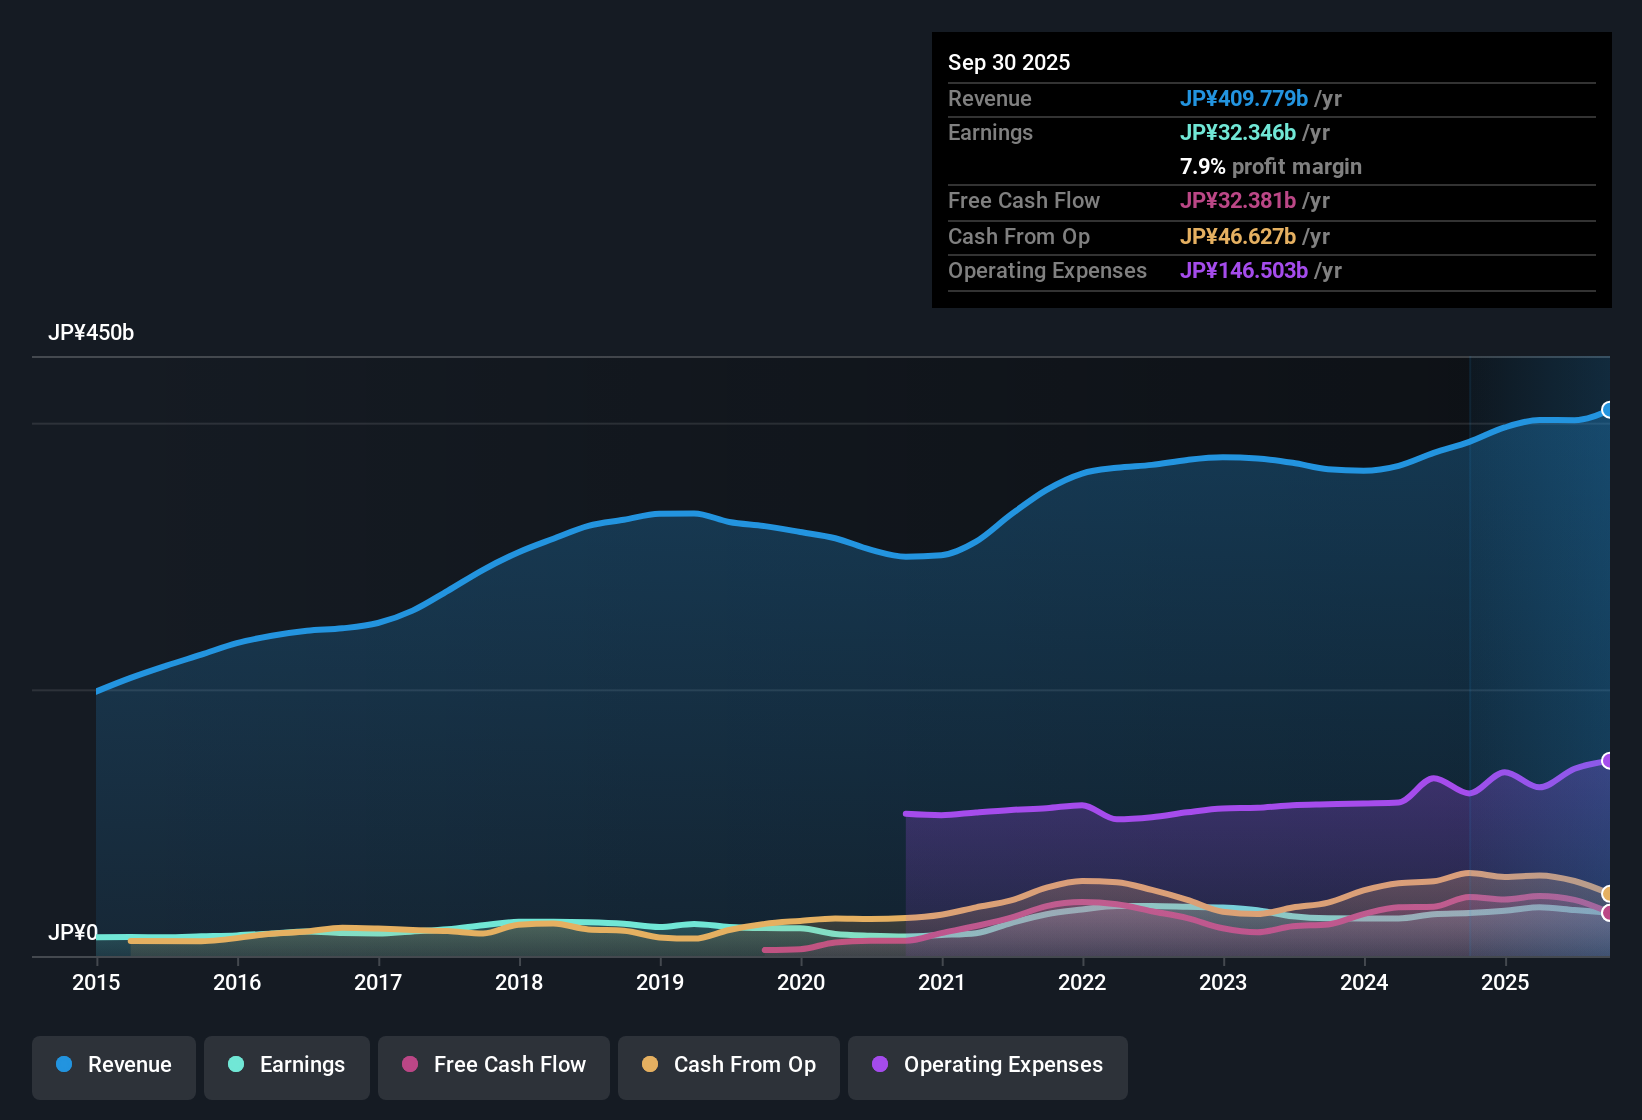
MISUMI Group (TSE:9962) is guiding for robust annual earnings growth of 11.14% and revenue expansion of 7.1%, both comfortably outpacing the broader Japanese market outlook. Shares are currently trading at ¥2,412, which is notably below the estimated fair value of ¥2,874.37. Despite a price-to-earnings ratio of 20.5x that stands above the JP Machinery sector average but below key peers, profit margins dipped to 7.9% from 8.3% a year ago and last year’s earnings growth landed at just 0.6% versus the five-year average of 7.9% per year. The outlook remains positive thanks to a steady pipeline of growth and no new risk warnings on the books.
See our full analysis for MISUMI Group.The real test is how these numbers stack up against the prevailing market narratives. Some views will get reinforced, while others may be challenged.
Curious how numbers become stories that shape markets? Explore Community Narratives
Profit Margins Ease Amid Slower Bottom-Line Growth
- Net profit margins slipped to 7.9% from last year’s 8.3%, while annual profit growth was just 0.6% against a five-year average of 7.9% per year.
- What’s surprising is that, despite the high quality of recurring earnings and robust revenue momentum, bottom-line expansion has lagged long-term trends. This is a dynamic that bears watching if industry headwinds worsen.
- The sharp moderation in earnings growth stands out in contrast to the more upbeat pace of top-line expansion.
- Margin pressure also softens the strongest bullish case for uninterrupted profitability, even as core operations remain steady.
Premium Valuation Still Below DCF Fair Value
- The price-to-earnings ratio stands at 20.5x, which is above the Japanese Machinery industry median of 13.3x but below the average among key listed peers at 26.6x. The current share price of ¥2,412 remains well under DCF fair value of ¥2,874.37.
- Bulls often point to MISUMI’s pricing, arguing the discount to DCF fair value represents an opportunity. However, the persistent premium against industry peers means buyers are paying up for stability and growth potential.
- Compared to the sector, the higher P/E may be justified by the steadier growth and absence of flagged risks.
- However, unless margin improvement resumes, valuation premiums could narrow if the growth profile falters.
Guidance Outpaces Broader Market Averages
- Full-year revenue is forecast to rise 7.1% annually, and earnings are guided to grow by 11.14%, outperforming the broader Japanese market’s outlook.
- The prevailing view holds that this above-average guidance sets MISUMI apart as a steady compounder, heavily supported by a resilient business model and sector momentum in factory automation.
- Current management projections highlight continued strength in end-market demand, countering concerns that recent profit deceleration could worsen.
- Analysts see this guidance as a strong anchor for near-term optimism, especially with no new risk warnings in recent disclosures.
For more on how the evidence stacks up across both market and analyst perspectives, check out the consensus take: 📊 Read the full MISUMI Group Consensus Narrative.
Next Steps
Don't just look at this quarter; the real story is in the long-term trend. We've done an in-depth analysis on MISUMI Group's growth and its valuation to see if today's price is a bargain. Add the company to your watchlist or portfolio now so you don't miss the next big move.
See What Else Is Out There
While MISUMI maintains steady growth forecasts, its slowing profit margins and recent earnings weakness highlight a vulnerability if sector momentum falters.
For investors who want more consistent financial performance, now is a great time to focus on stable growth stocks screener (2101 results) that deliver reliable growth no matter the market cycle.
This article by Simply Wall St is general in nature. We provide commentary based on historical data and analyst forecasts only using an unbiased methodology and our articles are not intended to be financial advice. It does not constitute a recommendation to buy or sell any stock, and does not take account of your objectives, or your financial situation. We aim to bring you long-term focused analysis driven by fundamental data. Note that our analysis may not factor in the latest price-sensitive company announcements or qualitative material. Simply Wall St has no position in any stocks mentioned.
New: Manage All Your Stock Portfolios in One Place
We've created the ultimate portfolio companion for stock investors, and it's free.
• Connect an unlimited number of Portfolios and see your total in one currency
• Be alerted to new Warning Signs or Risks via email or mobile
• Track the Fair Value of your stocks
Have feedback on this article? Concerned about the content? Get in touch with us directly. Alternatively, email editorial-team@simplywallst.com
About TSE:9962
MISUMI Group
Engages in the factory automation, die components, and VONA businesses in Japan, China, rest of Asia, the United States, Europe, and internationally.
Flawless balance sheet, good value and pays a dividend.
Similar Companies
Market Insights

Advertisement
Community Narratives
The "Molecular Pencil": Why Beam's Technology is Built to Win
Fair Value US$65.01|66.7% undervalued
DA
Community Contributor
The silent giant behind virtually every advanced chip powering AI, smartphones, and modern infrastructure.
Fair Value US$310.00|4.8% undervalued
OS
Community Contributor
ADP Stock: Solid Fundamentals, But AI Investments Test Its Margin Resilience
Fair Value US$387.77|34.5% undervalued
YI
Community Contributor
MINISO's fair value is projected at 26.69 with an anticipated PE ratio shift of 20x
Fair Value US$26.69|18.6% undervalued
BE
Community Contributor