MISUMI Group Inc.'s (TSE:9962) Fundamentals Look Pretty Strong: Could The Market Be Wrong About The Stock?


MISUMI Group (TSE:9962) has had a rough three months with its share price down 7.0%. But if you pay close attention, you might gather that its strong financials could mean that the stock could potentially see an increase in value in the long-term, given how markets usually reward companies with good financial health. Specifically, we decided to study MISUMI Group's ROE in this article.
Return on Equity or ROE is a test of how effectively a company is growing its value and managing investors’ money. In short, ROE shows the profit each dollar generates with respect to its shareholder investments.
View our latest analysis for MISUMI Group
How Is ROE Calculated?
The formula for return on equity is:
Return on Equity = Net Profit (from continuing operations) ÷ Shareholders' Equity
So, based on the above formula, the ROE for MISUMI Group is:
8.7% = JP¥31b ÷ JP¥360b (Based on the trailing twelve months to June 2024).
The 'return' is the amount earned after tax over the last twelve months. So, this means that for every ¥1 of its shareholder's investments, the company generates a profit of ¥0.09.
What Has ROE Got To Do With Earnings Growth?
So far, we've learned that ROE is a measure of a company's profitability. Depending on how much of these profits the company reinvests or "retains", and how effectively it does so, we are then able to assess a company’s earnings growth potential. Assuming everything else remains unchanged, the higher the ROE and profit retention, the higher the growth rate of a company compared to companies that don't necessarily bear these characteristics.
A Side By Side comparison of MISUMI Group's Earnings Growth And 8.7% ROE
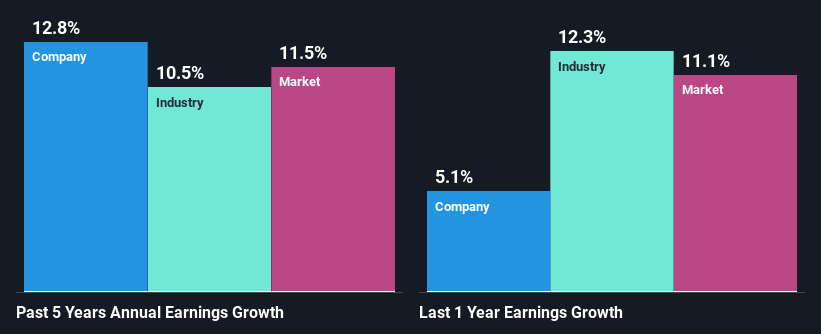
To begin with, MISUMI Group seems to have a respectable ROE. Further, the company's ROE compares quite favorably to the industry average of 7.3%. Probably as a result of this, MISUMI Group was able to see a decent growth of 13% over the last five years.
Next, on comparing with the industry net income growth, we found that MISUMI Group's growth is quite high when compared to the industry average growth of 10% in the same period, which is great to see.
Earnings growth is a huge factor in stock valuation. What investors need to determine next is if the expected earnings growth, or the lack of it, is already built into the share price. This then helps them determine if the stock is placed for a bright or bleak future. What is 9962 worth today? The intrinsic value infographic in our free research report helps visualize whether 9962 is currently mispriced by the market.
Is MISUMI Group Efficiently Re-investing Its Profits?
With a three-year median payout ratio of 25% (implying that the company retains 75% of its profits), it seems that MISUMI Group is reinvesting efficiently in a way that it sees respectable amount growth in its earnings and pays a dividend that's well covered.
Moreover, MISUMI Group is determined to keep sharing its profits with shareholders which we infer from its long history of paying a dividend for at least ten years.
Conclusion
On the whole, we feel that MISUMI Group's performance has been quite good. Particularly, we like that the company is reinvesting heavily into its business, and at a high rate of return. Unsurprisingly, this has led to an impressive earnings growth. That being so, a study of the latest analyst forecasts show that the company is expected to see a slowdown in its future earnings growth. Are these analysts expectations based on the broad expectations for the industry, or on the company's fundamentals? Click here to be taken to our analyst's forecasts page for the company.
New: Manage All Your Stock Portfolios in One Place
We've created the ultimate portfolio companion for stock investors, and it's free.
• Connect an unlimited number of Portfolios and see your total in one currency
• Be alerted to new Warning Signs or Risks via email or mobile
• Track the Fair Value of your stocks
Have feedback on this article? Concerned about the content? Get in touch with us directly. Alternatively, email editorial-team (at) simplywallst.com.
This article by Simply Wall St is general in nature. We provide commentary based on historical data and analyst forecasts only using an unbiased methodology and our articles are not intended to be financial advice. It does not constitute a recommendation to buy or sell any stock, and does not take account of your objectives, or your financial situation. We aim to bring you long-term focused analysis driven by fundamental data. Note that our analysis may not factor in the latest price-sensitive company announcements or qualitative material. Simply Wall St has no position in any stocks mentioned.
About TSE:9962
MISUMI Group
Engages in the factory automation and die components businesses worldwide.
Flawless balance sheet average dividend payer.

