Sumitomo (TSE:8053) has seen its stock make modest gains over the past month, attracting attention from investors trying to gauge whether this momentum can be sustained. The company’s returns have outperformed the broader market recently.
Sumitomo's momentum has picked up with a 17.25% share price gain over the past 90 days and a year-to-date return of 37.11%. Looking longer term, total shareholder returns have been outstanding, reaching 46.54% over one year and a remarkable 367.2% over five years. This consistency signals that investors see both robust performance and lasting growth potential.
Yet with Sumitomo trading just below analyst price targets and recent gains piling up, the key question emerges: Is the stock still undervalued, or are markets already pricing in all the future growth?
Advertisement
Price-to-Earnings of 9.3x: Is it justified?
Sumitomo’s current share price of ¥4,718 looks attractive given its modest price-to-earnings (P/E) ratio of 9.3x, which stands out among industry peers and relative to typical benchmarks for robustly profitable companies.
The P/E ratio shows how much investors are willing to pay for each yen of earnings. A lower P/E can often suggest that the market is not fully pricing in future earnings growth or that investors are being cautious despite strong performance.
In Sumitomo's case, the 9.3x ratio is not only cheaper than the peer average (13x) but also trails the Japanese Trade Distributors industry average of 10.1x. Additionally, compared to what regression analyses suggest is a fair P/E ratio (19.9x), Sumitomo is trading at a noticeable discount. This provides a level the market could move toward if confidence in continued earnings delivery rises.
However, slower annual revenue growth and only marginal net income gains could challenge Sumitomo’s momentum if these trends persist in the coming quarters.
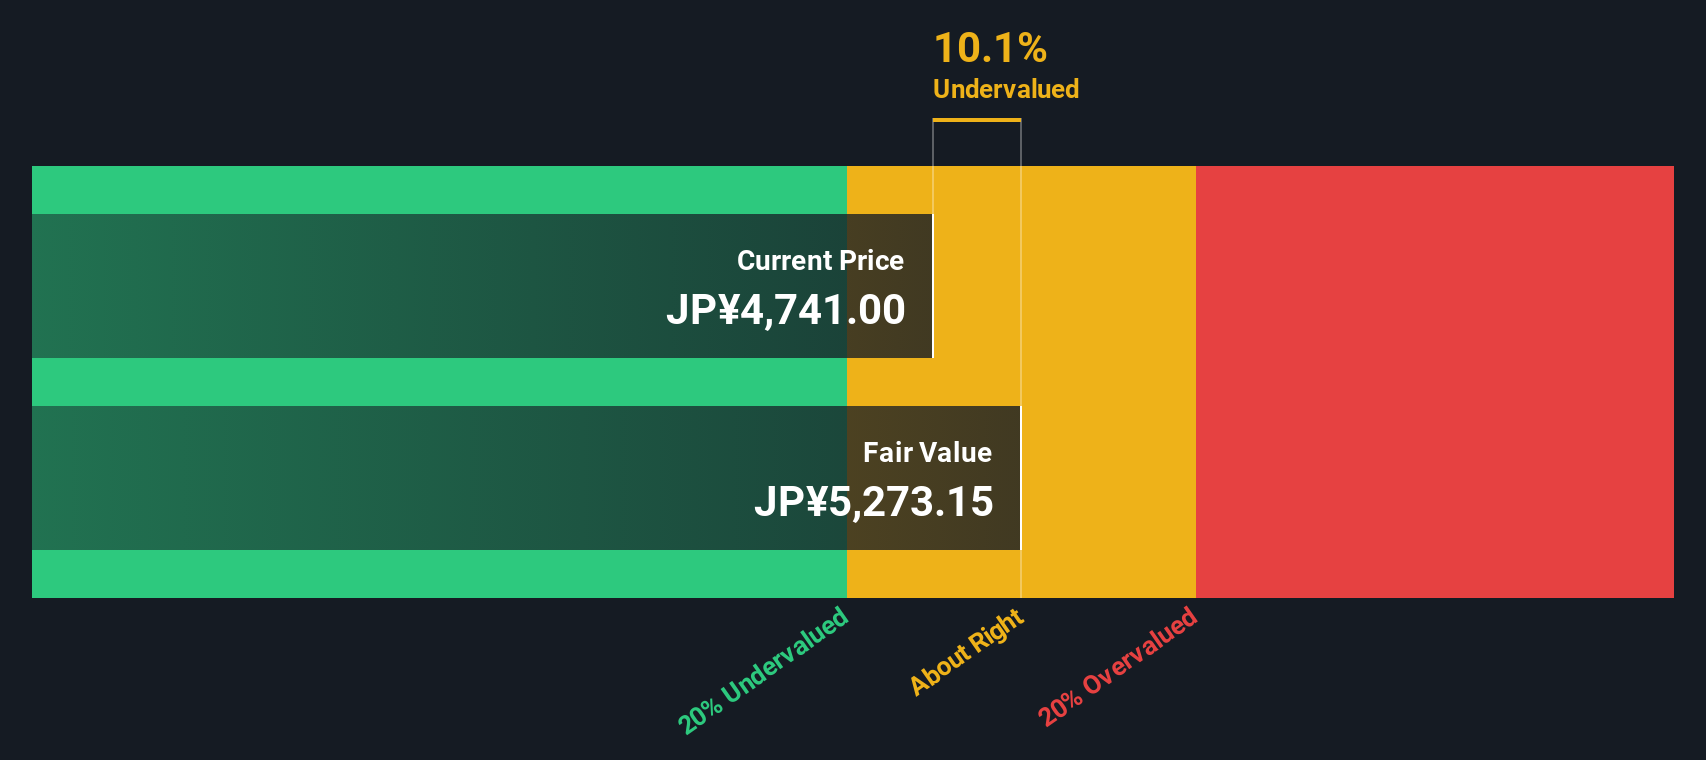
The SWS DCF model offers another lens on Sumitomo's current price. Based on the model, the stock trades at a significant 10.5% discount to its estimated fair value. This points to deeper undervaluation than suggested by price-to-earnings. Could the market be overlooking something, or is caution warranted?
Simply Wall St performs a discounted cash flow (DCF) on every stock in the world every day (check out Sumitomo for example). We show the entire calculation in full. You can track the result in your watchlist or portfolio and be alerted when this changes, or use our stock screener to discover 876 undervalued stocks based on their cash flows. If you save a screener we even alert you when new companies match - so you never miss a potential opportunity.
Build Your Own Sumitomo Narrative
If our analysis doesn’t match your personal outlook, or you’d rather dig into the numbers yourself, you can start building your own perspective in just a few minutes. So why not Do it your way.
Don’t miss your chance to uncover powerful trends and fresh opportunities that could give your portfolio the edge it needs for the months ahead.
Unlock the potential of emerging technologies by checking out these 25 AI penny stocks, which are making waves in artificial intelligence across global markets.
This article by Simply Wall St is general in nature. We provide commentary based on historical data
and analyst forecasts only using an unbiased methodology and our articles are not intended to be financial advice. It does not constitute a recommendation to buy or sell any stock, and does not take account of your objectives, or your
financial situation. We aim to bring you long-term focused analysis driven by fundamental data.
Note that our analysis may not factor in the latest price-sensitive company announcements or qualitative material.
Simply Wall St has no position in any stocks mentioned.
New: Manage All Your Stock Portfolios in One Place
We've created the ultimate portfolio companion for stock investors, and it's free.
• Connect an unlimited number of Portfolios and see your total in one currency • Be alerted to new Warning Signs or Risks via email or mobile • Track the Fair Value of your stocks