- Japan
- /
- Trade Distributors
- /
- TSE:8002
Investors in Marubeni (TSE:8002) have seen massive returns of 319% over the past five years


It hasn't been the best quarter for Marubeni Corporation (TSE:8002) shareholders, since the share price has fallen 19% in that time. But that scarcely detracts from the really solid long term returns generated by the company over five years. It's fair to say most would be happy with 233% the gain in that time. To some, the recent pullback wouldn't be surprising after such a fast rise. Only time will tell if there is still too much optimism currently reflected in the share price.
Let's take a look at the underlying fundamentals over the longer term, and see if they've been consistent with shareholders returns.
See our latest analysis for Marubeni
To quote Buffett, 'Ships will sail around the world but the Flat Earth Society will flourish. There will continue to be wide discrepancies between price and value in the marketplace...' By comparing earnings per share (EPS) and share price changes over time, we can get a feel for how investor attitudes to a company have morphed over time.
During five years of share price growth, Marubeni achieved compound earnings per share (EPS) growth of 19% per year. This EPS growth is lower than the 27% average annual increase in the share price. So it's fair to assume the market has a higher opinion of the business than it did five years ago. That's not necessarily surprising considering the five-year track record of earnings growth.
The company's earnings per share (over time) is depicted in the image below (click to see the exact numbers).
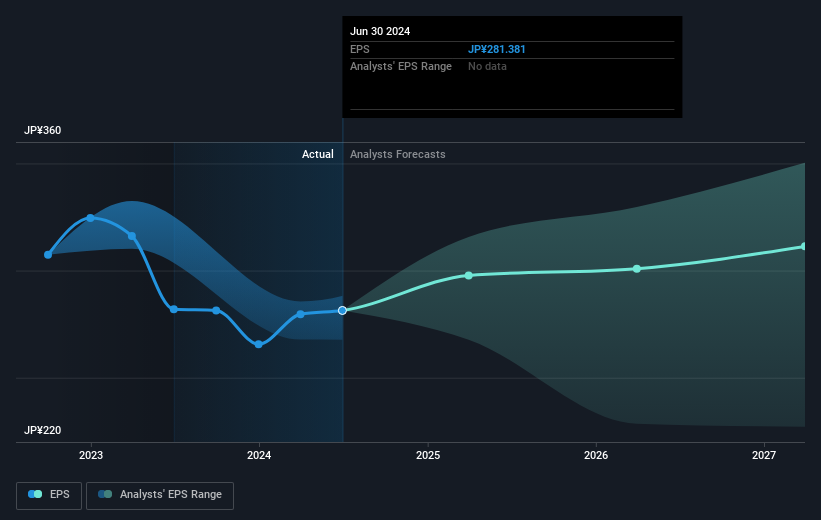
Before buying or selling a stock, we always recommend a close examination of historic growth trends, available here.
What About Dividends?
As well as measuring the share price return, investors should also consider the total shareholder return (TSR). Whereas the share price return only reflects the change in the share price, the TSR includes the value of dividends (assuming they were reinvested) and the benefit of any discounted capital raising or spin-off. Arguably, the TSR gives a more comprehensive picture of the return generated by a stock. We note that for Marubeni the TSR over the last 5 years was 319%, which is better than the share price return mentioned above. The dividends paid by the company have thusly boosted the total shareholder return.
A Different Perspective
Marubeni shareholders are up 8.9% for the year (even including dividends). But that was short of the market average. It's probably a good sign that the company has an even better long term track record, having provided shareholders with an annual TSR of 33% over five years. Maybe the share price is just taking a breather while the business executes on its growth strategy. It's always interesting to track share price performance over the longer term. But to understand Marubeni better, we need to consider many other factors. For instance, we've identified 2 warning signs for Marubeni that you should be aware of.
If you would prefer to check out another company -- one with potentially superior financials -- then do not miss this free list of companies that have proven they can grow earnings.
Please note, the market returns quoted in this article reflect the market weighted average returns of stocks that currently trade on Japanese exchanges.
New: Manage All Your Stock Portfolios in One Place
We've created the ultimate portfolio companion for stock investors, and it's free.
• Connect an unlimited number of Portfolios and see your total in one currency
• Be alerted to new Warning Signs or Risks via email or mobile
• Track the Fair Value of your stocks
Have feedback on this article? Concerned about the content? Get in touch with us directly. Alternatively, email editorial-team (at) simplywallst.com.
This article by Simply Wall St is general in nature. We provide commentary based on historical data and analyst forecasts only using an unbiased methodology and our articles are not intended to be financial advice. It does not constitute a recommendation to buy or sell any stock, and does not take account of your objectives, or your financial situation. We aim to bring you long-term focused analysis driven by fundamental data. Note that our analysis may not factor in the latest price-sensitive company announcements or qualitative material. Simply Wall St has no position in any stocks mentioned.
About TSE:8002
Marubeni
Marubeni Corporation purchases, distributes, and markets industrial and consumer goods.
Excellent balance sheet, good value and pays a dividend.

