Stock Analysis
IHI (TSE:7013) shareholder returns have been favorable, earning 83% in 3 years


By buying an index fund, investors can approximate the average market return. But if you buy good businesses at attractive prices, your portfolio returns could exceed the average market return. For example, IHI Corporation (TSE:7013) shareholders have seen the share price rise 69% over three years, well in excess of the market return (35%, not including dividends). However, more recent returns haven't been as impressive as that, with the stock returning just 12% in the last year , including dividends .
The past week has proven to be lucrative for IHI investors, so let's see if fundamentals drove the company's three-year performance.
See our latest analysis for IHI
While the efficient markets hypothesis continues to be taught by some, it has been proven that markets are over-reactive dynamic systems, and investors are not always rational. One imperfect but simple way to consider how the market perception of a company has shifted is to compare the change in the earnings per share (EPS) with the share price movement.
Over the last three years, IHI failed to grow earnings per share, which fell 45% (annualized).
So we doubt that the market is looking to EPS for its main judge of the company's value. Therefore, we think it's worth considering other metrics as well.
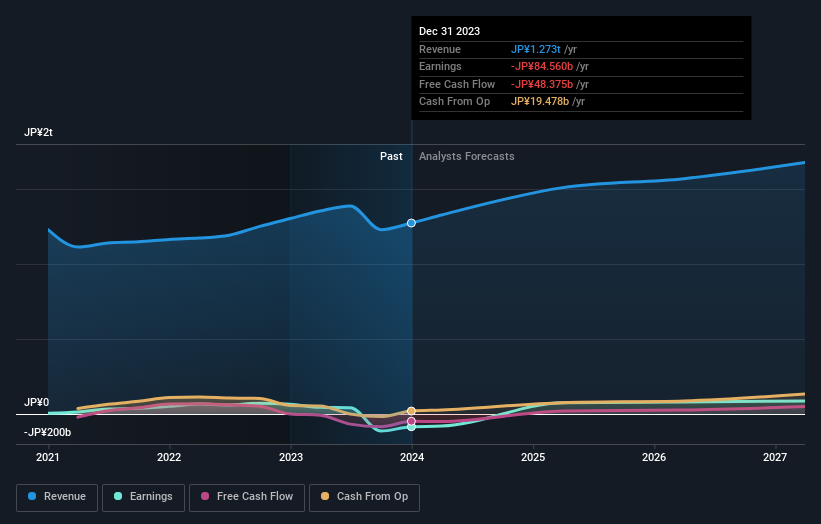
It may well be that IHI revenue growth rate of 5.0% over three years has convinced shareholders to believe in a brighter future. In that case, the company may be sacrificing current earnings per share to drive growth, and maybe shareholder's faith in better days ahead will be rewarded.
The graphic below depicts how earnings and revenue have changed over time (unveil the exact values by clicking on the image).
IHI is a well known stock, with plenty of analyst coverage, suggesting some visibility into future growth. So we recommend checking out this free report showing consensus forecasts
What About Dividends?
It is important to consider the total shareholder return, as well as the share price return, for any given stock. The TSR incorporates the value of any spin-offs or discounted capital raisings, along with any dividends, based on the assumption that the dividends are reinvested. Arguably, the TSR gives a more comprehensive picture of the return generated by a stock. As it happens, IHI's TSR for the last 3 years was 83%, which exceeds the share price return mentioned earlier. The dividends paid by the company have thusly boosted the total shareholder return.
A Different Perspective
IHI shareholders gained a total return of 12% during the year. Unfortunately this falls short of the market return. On the bright side, the longer term returns (running at about 13% a year, over half a decade) look better. It may well be that this is a business worth popping on the watching, given the continuing positive reception, over time, from the market. It's always interesting to track share price performance over the longer term. But to understand IHI better, we need to consider many other factors. Consider for instance, the ever-present spectre of investment risk. We've identified 2 warning signs with IHI , and understanding them should be part of your investment process.
For those who like to find winning investments this free list of growing companies with recent insider purchasing, could be just the ticket.
Please note, the market returns quoted in this article reflect the market weighted average returns of stocks that currently trade on Japanese exchanges.
Valuation is complex, but we're helping make it simple.
Find out whether IHI is potentially over or undervalued by checking out our comprehensive analysis, which includes fair value estimates, risks and warnings, dividends, insider transactions and financial health.
View the Free AnalysisHave feedback on this article? Concerned about the content? Get in touch with us directly. Alternatively, email editorial-team (at) simplywallst.com.
This article by Simply Wall St is general in nature. We provide commentary based on historical data and analyst forecasts only using an unbiased methodology and our articles are not intended to be financial advice. It does not constitute a recommendation to buy or sell any stock, and does not take account of your objectives, or your financial situation. We aim to bring you long-term focused analysis driven by fundamental data. Note that our analysis may not factor in the latest price-sensitive company announcements or qualitative material. Simply Wall St has no position in any stocks mentioned.
About TSE:7013
IHI
Operates in resources, energy, and environment; social infrastructure and offshore facilities; industrial systems and general-purpose machinery; aero engine, space, and defense; and other business areas in Japan and internationally.
Reasonable growth potential and fair value.

