- Japan
- /
- Auto Components
- /
- TSE:5184
3 Leading Japanese Dividend Stocks Yielding Up To 4.5%

Reviewed by Simply Wall St

Japan's stock markets have seen a rise, with the Nikkei 225 Index gaining 2.45% and the broader TOPIX Index up 0.45%, driven by yen weakness which has bolstered profit outlooks for exporters. In this context, Japanese dividend stocks are attracting attention as they offer potential income opportunities amidst favorable market conditions. A good dividend stock typically combines a consistent payout history with financial stability, making it an appealing choice for investors looking to capitalize on these trends in Japan's evolving economic landscape.
Top 10 Dividend Stocks In Japan
| Name | Dividend Yield | Dividend Rating |
| Tsubakimoto Chain (TSE:6371) | 4.11% | ★★★★★★ |
| Globeride (TSE:7990) | 4.18% | ★★★★★★ |
| Yamato Kogyo (TSE:5444) | 4.14% | ★★★★★★ |
| Intelligent Wave (TSE:4847) | 3.93% | ★★★★★★ |
| KurimotoLtd (TSE:5602) | 5.19% | ★★★★★★ |
| Innotech (TSE:9880) | 4.74% | ★★★★★★ |
| CAC Holdings (TSE:4725) | 4.51% | ★★★★★★ |
| Business Brain Showa-Ota (TSE:9658) | 4.24% | ★★★★★★ |
| FALCO HOLDINGS (TSE:4671) | 6.20% | ★★★★★★ |
| GakkyushaLtd (TSE:9769) | 4.48% | ★★★★★★ |
Click here to see the full list of 440 stocks from our Top Japanese Dividend Stocks screener.
Let's dive into some prime choices out of the screener.
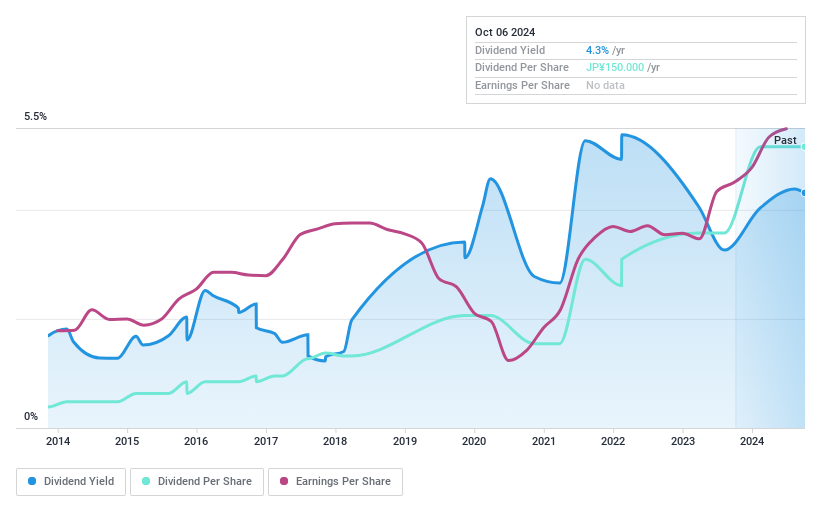
Nichirin (TSE:5184)
Simply Wall St Dividend Rating: ★★★★★☆
Overview: Nichirin Co., Ltd. manufactures and sells automotive and housing hoses, along with related parts, both in Japan and internationally, with a market cap of ¥48.93 billion.
Operations: Nichirin Co., Ltd.'s revenue segments are comprised of ¥24.69 billion from Asia, ¥12.44 billion from China, ¥35.54 billion from Japan, ¥6.73 billion from Europe, and ¥14.97 billion from North America.
Dividend Yield: 4%
Nichirin's dividend payments, while offering a yield of 4.04%—placing it in the top 25% of Japanese dividend payers—have been volatile over the past decade. Despite this instability, dividends are well covered by earnings and cash flows with payout ratios of 34.7% and 29.7%, respectively. The company trades significantly below its estimated fair value, enhancing its appeal as a value investment. Recent share buybacks aim to improve capital efficiency and shareholder returns, potentially stabilizing future dividends.
- Dive into the specifics of Nichirin here with our thorough dividend report.
- Our comprehensive valuation report raises the possibility that Nichirin is priced lower than what may be justified by its financials.
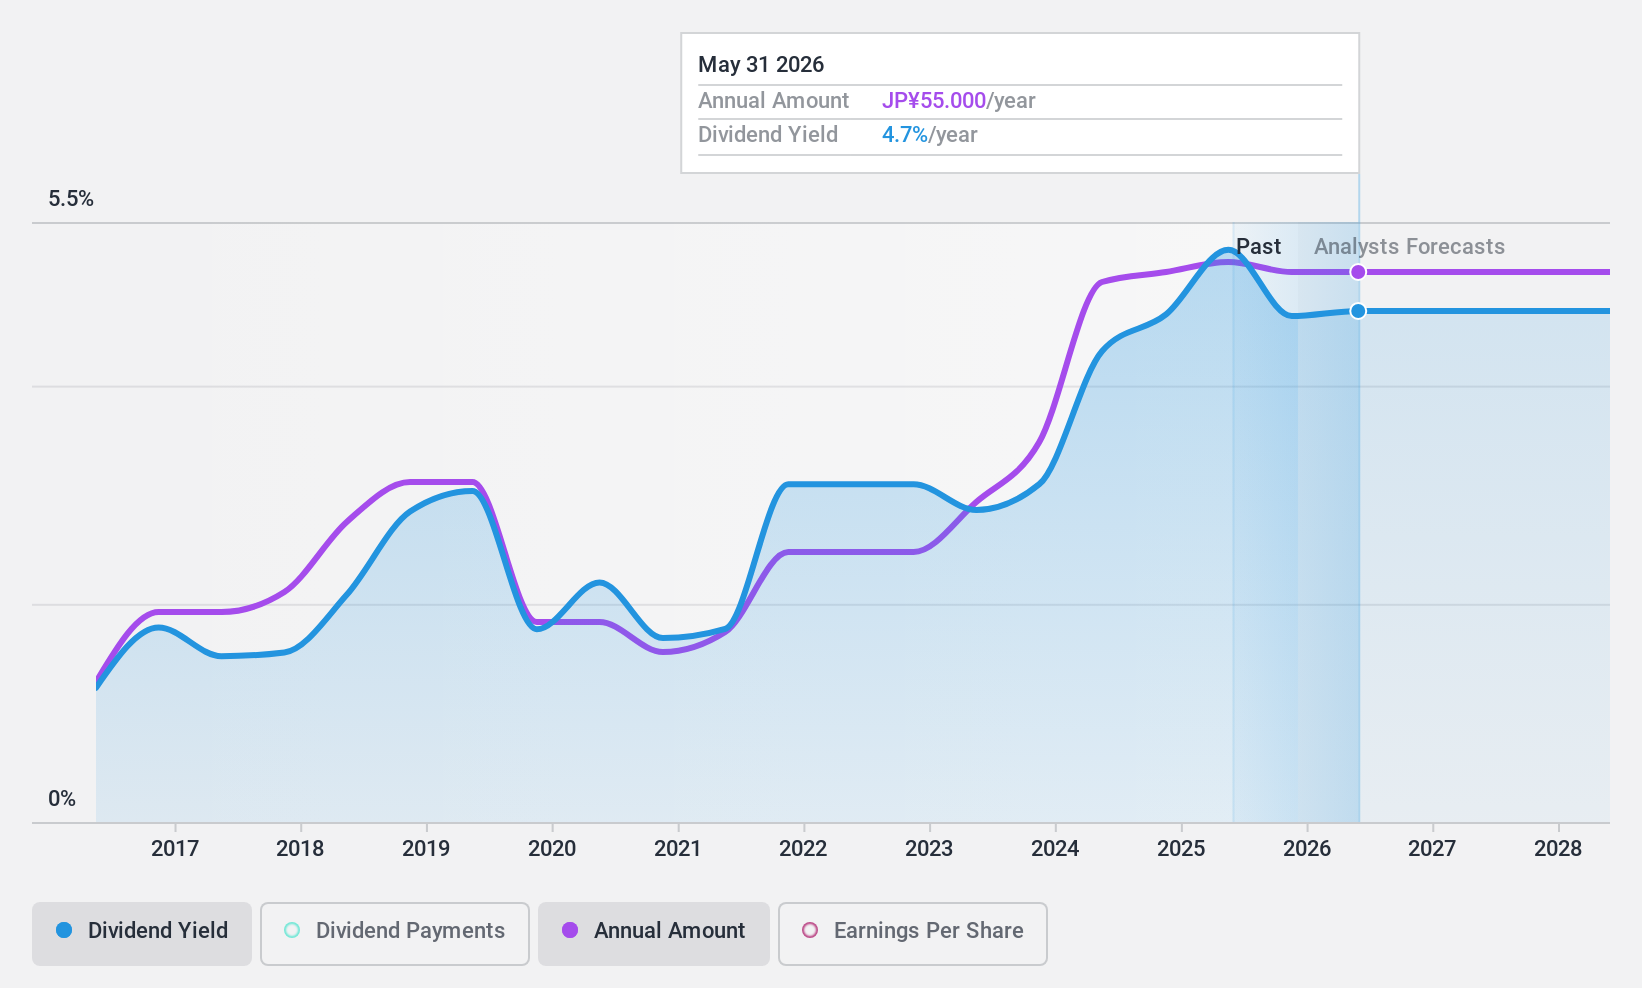
Cosel (TSE:6905)
Simply Wall St Dividend Rating: ★★★★★☆
Overview: Cosel Co., Ltd. manufactures and sells electrical components and EMI filters both in Japan and internationally, with a market cap of approximately ¥49.11 billion.
Operations: Cosel Co., Ltd. generates revenue through the manufacturing and sale of electrical components and EMI filters in both domestic and international markets.
Dividend Yield: 4.5%
Cosel's dividend yield of 4.52% ranks it among the top 25% of Japanese dividend payers, with payouts covered by earnings and cash flows at ratios of 48.7% and 51.4%, respectively. Despite past volatility in dividends, recent growth over a decade is notable. Trading at a significant discount to fair value suggests potential for capital appreciation, although shareholder dilution last year poses a concern for stability in future dividends.
- Get an in-depth perspective on Cosel's performance by reading our dividend report here.
- Our valuation report unveils the possibility Cosel's shares may be trading at a premium.
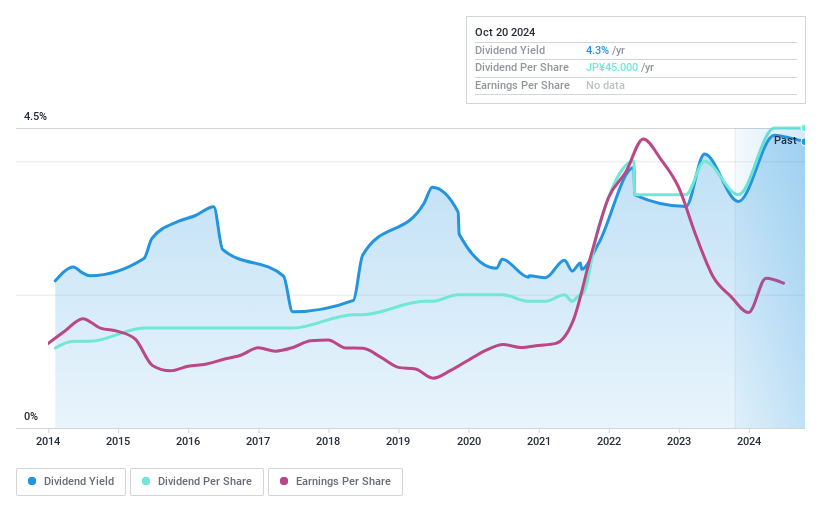
JK Holdings (TSE:9896)
Simply Wall St Dividend Rating: ★★★★★☆
Overview: JK Holdings Co., Ltd. operates in wholesale, plywood manufacturing and wood processing, franchise, construction works, and other businesses both in Japan and internationally, with a market cap of ¥29.89 billion.
Operations: JK Holdings Co., Ltd. generates revenue through its subsidiaries in wholesale, plywood manufacturing and wood processing, franchise operations, and construction works across Japan and internationally.
Dividend Yield: 4.2%
JK Holdings' dividend yield of 4.17% places it in the top 25% of Japanese payers, with dividends well-covered by earnings and cash flows at low payout ratios of 23.7% and 6.8%, respectively. Despite growth over the past decade, dividends have been volatile and unreliable, with significant annual drops exceeding 20%. Trading significantly below estimated fair value suggests potential for capital appreciation, although recent removal from the S&P Global BMI Index may affect investor sentiment.
- Click here and access our complete dividend analysis report to understand the dynamics of JK Holdings.
- The analysis detailed in our JK Holdings valuation report hints at an deflated share price compared to its estimated value.
Where To Now?
- Unlock our comprehensive list of 440 Top Japanese Dividend Stocks by clicking here.
- Have you diversified into these companies? Leverage the power of Simply Wall St's portfolio to keep a close eye on market movements affecting your investments.
- Discover a world of investment opportunities with Simply Wall St's free app and access unparalleled stock analysis across all markets.
Ready To Venture Into Other Investment Styles?
- Explore high-performing small cap companies that haven't yet garnered significant analyst attention.
- Fuel your portfolio with companies showing strong growth potential, backed by optimistic outlooks both from analysts and management.
- Find companies with promising cash flow potential yet trading below their fair value.
This article by Simply Wall St is general in nature. We provide commentary based on historical data and analyst forecasts only using an unbiased methodology and our articles are not intended to be financial advice. It does not constitute a recommendation to buy or sell any stock, and does not take account of your objectives, or your financial situation. We aim to bring you long-term focused analysis driven by fundamental data. Note that our analysis may not factor in the latest price-sensitive company announcements or qualitative material. Simply Wall St has no position in any stocks mentioned.
Valuation is complex, but we're here to simplify it.
Discover if Nichirin might be undervalued or overvalued with our detailed analysis, featuring fair value estimates, potential risks, dividends, insider trades, and its financial condition.
Access Free AnalysisHave feedback on this article? Concerned about the content? Get in touch with us directly. Alternatively, email editorial-team@simplywallst.com
About TSE:5184
Nichirin
Engages in manufacture and sale of automotive and housing hoses, and related parts in Japan and internationally.
Flawless balance sheet with solid track record and pays a dividend.
