Advertisement
Tsubakimoto Chain (TSE:6371): How Does Valuation Stack Up After Guidance Cut on US and China Weakness?

Simply Wall St
Reviewed by Simply Wall St
Tsubakimoto Chain (TSE:6371) revised its earnings outlook for the year ending March 2026, citing slower activity in its US and Chinese material handling segments. The company now forecasts lower revenue and profit compared to earlier expectations.
See our latest analysis for Tsubakimoto Chain.
Tsubakimoto Chain’s announcement to lower its earnings forecast comes after a strong run for shareholders, with a 12.93% total return over the past year and an impressive 128.96% total shareholder return across three years. While the latest guidance has rattled short-term sentiment, the company’s consistent long-term performance shows investor confidence is not fading overnight, even with recent pressure in its material handling segments.
If you’re curious to see what other companies with growth stories and high insider backing are doing, this could be the perfect moment to discover fast growing stocks with high insider ownership
With expectations scaled back and performance in key segments under pressure, is Tsubakimoto Chain undervalued now, or is any future upside already reflected in its share price? Could this dip be a real buying opportunity?
Price-to-Earnings of 9.4x: Is it justified?
Tsubakimoto Chain's shares currently trade on a price-to-earnings (P/E) ratio of 9.4x, positioning the stock as more attractively valued than both peers and the broader market.
The price-to-earnings ratio measures how much investors are willing to pay for each unit of a company’s reported earnings, acting as a quick pulse check on the market’s growth and profitability expectations. For a machinery sector name like Tsubakimoto Chain, a lower P/E can signal that the market is not pricing in aggressive growth or may be cautious about sector headwinds.
Compared to the JP Machinery industry average of 13.2x and a peer average of 19.1x, Tsubakimoto Chain’s 9.4x multiple signals a sizeable discount. This difference is even more apparent when compared with an estimated fair ratio of 11.6x, suggesting the market could adjust its valuation upward if sentiment shifts.
Explore the SWS fair ratio for Tsubakimoto Chain
Result: Price-to-Earnings of 9.4x (UNDERVALUED)
However, persistent revenue pressure and negative net income growth could challenge bullish expectations if these trends continue throughout the coming year.
Find out about the key risks to this Tsubakimoto Chain narrative.
Another View: Discounted Cash Flow Model Weighs In
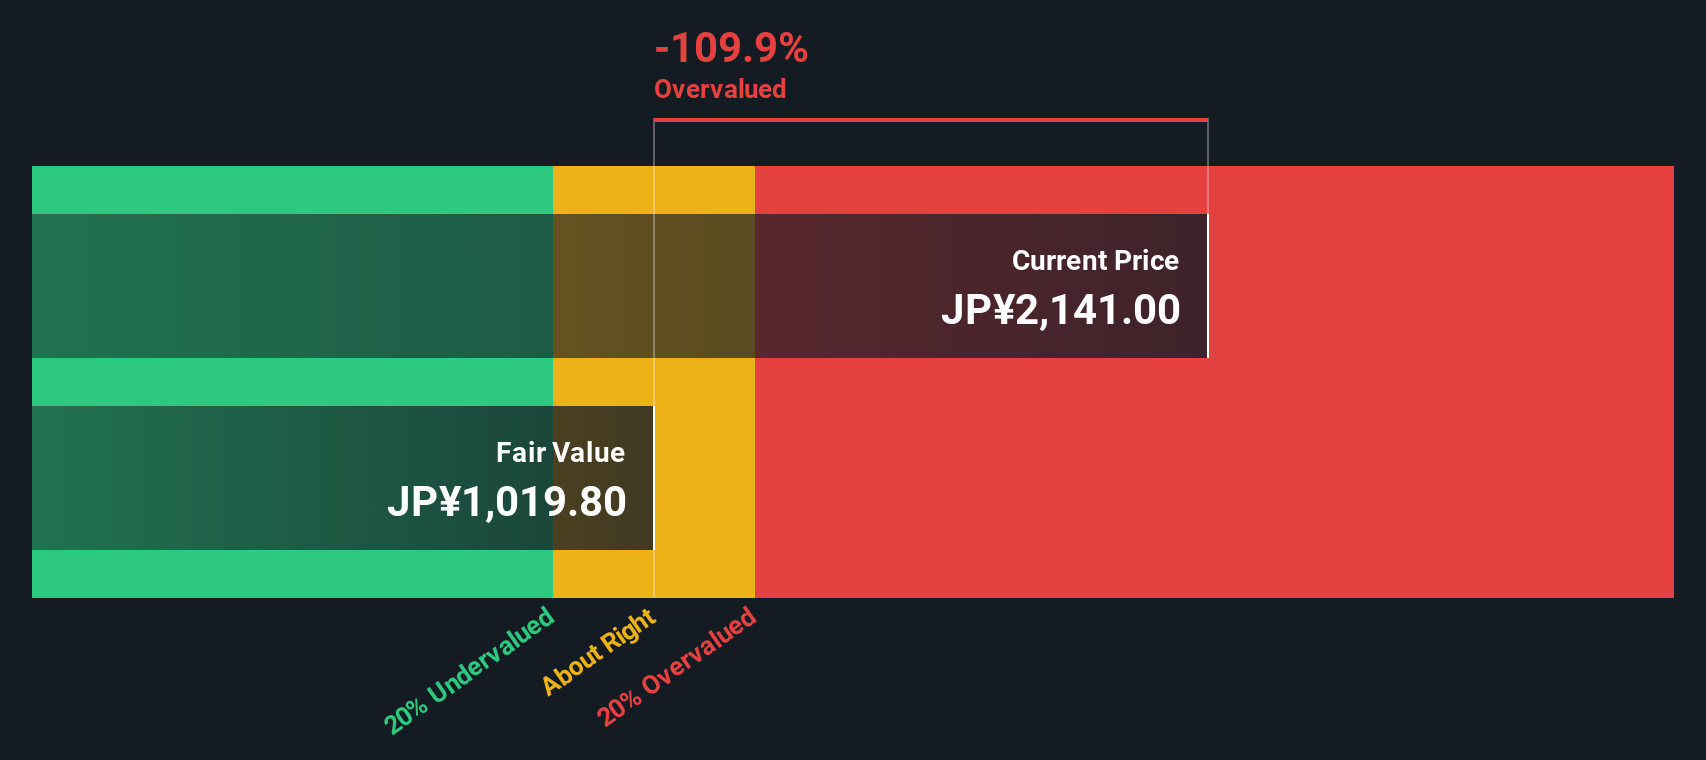
While the price-to-earnings ratio suggests Tsubakimoto Chain may be undervalued, our DCF model provides a more cautious view. According to this approach, shares are currently trading above the estimated fair value, which could indicate potential downside based on future cash flows. Should value hunters be cautious, or is the market factoring in variables that the numbers do not capture?
Look into how the SWS DCF model arrives at its fair value.
Simply Wall St performs a discounted cash flow (DCF) on every stock in the world every day (check out Tsubakimoto Chain for example). We show the entire calculation in full. You can track the result in your watchlist or portfolio and be alerted when this changes, or use our stock screener to discover 849 undervalued stocks based on their cash flows. If you save a screener we even alert you when new companies match - so you never miss a potential opportunity.
Build Your Own Tsubakimoto Chain Narrative
If you see things differently or want to dig into the numbers yourself, shaping your own view takes just a few minutes. Do it your way.
A great starting point for your Tsubakimoto Chain research is our analysis highlighting 4 key rewards and 2 important warning signs that could impact your investment decision.
Looking for More Investment Ideas?
Don’t let opportunity pass you by. The Simply Wall Street Screener puts tomorrow’s trends and hidden gems at your fingertips. Start building your smarter portfolio today.
- Uncover value as you scan these 849 undervalued stocks based on cash flows, where overlooked companies could be set for a powerful rebound.
- Target growth by checking out these 25 AI penny stocks, featuring visionary businesses at the forefront of artificial intelligence innovation.
- Secure your portfolio’s income with these 17 dividend stocks with yields > 3%, highlighting companies that have yields over 3% and strong fundamentals.
This article by Simply Wall St is general in nature. We provide commentary based on historical data and analyst forecasts only using an unbiased methodology and our articles are not intended to be financial advice. It does not constitute a recommendation to buy or sell any stock, and does not take account of your objectives, or your financial situation. We aim to bring you long-term focused analysis driven by fundamental data. Note that our analysis may not factor in the latest price-sensitive company announcements or qualitative material. Simply Wall St has no position in any stocks mentioned.
Valuation is complex, but we're here to simplify it.
Discover if Tsubakimoto Chain might be undervalued or overvalued with our detailed analysis, featuring fair value estimates, potential risks, dividends, insider trades, and its financial condition.
Access Free AnalysisHave feedback on this article? Concerned about the content? Get in touch with us directly. Alternatively, email editorial-team@simplywallst.com
About TSE:6371
Tsubakimoto Chain
Manufactures and sells chains, motion control, mobility, materials handling systems components in Japan.
Flawless balance sheet 6 star dividend payer.
Market Insights

Advertisement
Community Narratives
The company that turned a verb into a global necessity and basically runs the modern internet, digital ads, smartphones, maps, and AI.
Fair Value US$300.00|5.1% undervalued
OS
Community Contributor
Flowers Foods Pays A Fair Price For Health
Fair Value US$16.12|27.7% undervalued
NV
Community Contributor
TMX Group will thrive with 33.3% profit margin and enduring market moat
Fair Value CA$49.90|0.2% overvalued
LI
Community Contributor
The "Molecular Pencil": Why Beam's Technology is Built to Win
Fair Value US$65.01|64.4% undervalued
DA
Community Contributor