Even though Takatori (TSE:6338) has lost JP¥1.7b market cap in last 7 days, shareholders are still up 390% over 5 years


It hasn't been the best quarter for Takatori Corporation (TSE:6338) shareholders, since the share price has fallen 22% in that time. But that doesn't change the fact that the returns over the last half decade have been spectacular. In fact, during that period, the share price climbed 357%. Impressive! Arguably, the recent fall is to be expected after such a strong rise. The most important thing for savvy investors to consider is whether the underlying business can justify the share price gain. Unfortunately not all shareholders will have held it for the long term, so spare a thought for those caught in the 50% decline over the last twelve months.
Although Takatori has shed JP¥1.7b from its market cap this week, let's take a look at its longer term fundamental trends and see if they've driven returns.
Check out our latest analysis for Takatori
To quote Buffett, 'Ships will sail around the world but the Flat Earth Society will flourish. There will continue to be wide discrepancies between price and value in the marketplace...' One way to examine how market sentiment has changed over time is to look at the interaction between a company's share price and its earnings per share (EPS).
During the last half decade, Takatori became profitable. That kind of transition can be an inflection point that justifies a strong share price gain, just as we have seen here. Since the company was unprofitable five years ago, but not three years ago, it's worth taking a look at the returns in the last three years, too. Indeed, the Takatori share price has gained 160% in three years. During the same period, EPS grew by 79% each year. This EPS growth is higher than the 37% average annual increase in the share price over the same three years. Therefore, it seems the market has moderated its expectations for growth, somewhat. This cautious sentiment is reflected in its (fairly low) P/E ratio of 6.19.
You can see below how EPS has changed over time (discover the exact values by clicking on the image).
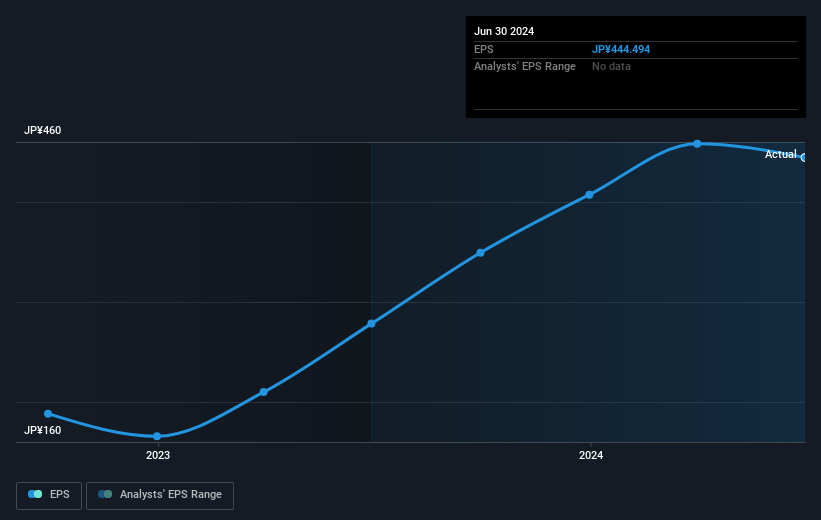
Dive deeper into Takatori's key metrics by checking this interactive graph of Takatori's earnings, revenue and cash flow.
What About Dividends?
It is important to consider the total shareholder return, as well as the share price return, for any given stock. The TSR is a return calculation that accounts for the value of cash dividends (assuming that any dividend received was reinvested) and the calculated value of any discounted capital raisings and spin-offs. So for companies that pay a generous dividend, the TSR is often a lot higher than the share price return. We note that for Takatori the TSR over the last 5 years was 390%, which is better than the share price return mentioned above. This is largely a result of its dividend payments!
A Different Perspective
Investors in Takatori had a tough year, with a total loss of 50% (including dividends), against a market gain of about 11%. However, keep in mind that even the best stocks will sometimes underperform the market over a twelve month period. Longer term investors wouldn't be so upset, since they would have made 37%, each year, over five years. It could be that the recent sell-off is an opportunity, so it may be worth checking the fundamental data for signs of a long term growth trend. It's always interesting to track share price performance over the longer term. But to understand Takatori better, we need to consider many other factors. To that end, you should be aware of the 1 warning sign we've spotted with Takatori .
We will like Takatori better if we see some big insider buys. While we wait, check out this free list of undervalued stocks (mostly small caps) with considerable, recent, insider buying.
Please note, the market returns quoted in this article reflect the market weighted average returns of stocks that currently trade on Japanese exchanges.
Valuation is complex, but we're here to simplify it.
Discover if Takatori might be undervalued or overvalued with our detailed analysis, featuring fair value estimates, potential risks, dividends, insider trades, and its financial condition.
Access Free AnalysisHave feedback on this article? Concerned about the content? Get in touch with us directly. Alternatively, email editorial-team (at) simplywallst.com.
This article by Simply Wall St is general in nature. We provide commentary based on historical data and analyst forecasts only using an unbiased methodology and our articles are not intended to be financial advice. It does not constitute a recommendation to buy or sell any stock, and does not take account of your objectives, or your financial situation. We aim to bring you long-term focused analysis driven by fundamental data. Note that our analysis may not factor in the latest price-sensitive company announcements or qualitative material. Simply Wall St has no position in any stocks mentioned.
About TSE:6338
Takatori
Manufactures and sells semiconductor and liquid crystal related equipment, multi wire saws and textile machinery, and medical devices primarily in Japan and internationally.
Solid track record with excellent balance sheet.
