A Piece Of The Puzzle Missing From Sumitomo Heavy Industries, Ltd.'s (TSE:6302) Share Price
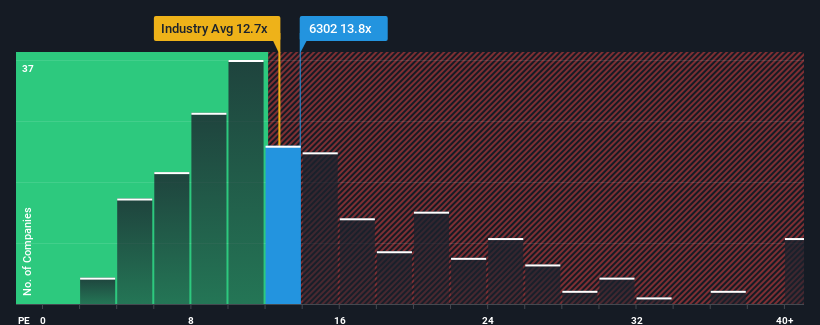
There wouldn't be many who think Sumitomo Heavy Industries, Ltd.'s (TSE:6302) price-to-earnings (or "P/E") ratio of 13.8x is worth a mention when the median P/E in Japan is similar at about 14x. Although, it's not wise to simply ignore the P/E without explanation as investors may be disregarding a distinct opportunity or a costly mistake.
Sumitomo Heavy Industries certainly has been doing a good job lately as it's been growing earnings more than most other companies. It might be that many expect the strong earnings performance to wane, which has kept the P/E from rising. If not, then existing shareholders have reason to be feeling optimistic about the future direction of the share price.
Check out our latest analysis for Sumitomo Heavy Industries

Does Growth Match The P/E?
Sumitomo Heavy Industries' P/E ratio would be typical for a company that's only expected to deliver moderate growth, and importantly, perform in line with the market.
Retrospectively, the last year delivered an exceptional 156% gain to the company's bottom line. Pleasingly, EPS has also lifted 35% in aggregate from three years ago, thanks to the last 12 months of growth. So we can start by confirming that the company has done a great job of growing earnings over that time.
Looking ahead now, EPS is anticipated to climb by 17% per year during the coming three years according to the five analysts following the company. That's shaping up to be materially higher than the 9.6% each year growth forecast for the broader market.
With this information, we find it interesting that Sumitomo Heavy Industries is trading at a fairly similar P/E to the market. It may be that most investors aren't convinced the company can achieve future growth expectations.
The Bottom Line On Sumitomo Heavy Industries' P/E
We'd say the price-to-earnings ratio's power isn't primarily as a valuation instrument but rather to gauge current investor sentiment and future expectations.
We've established that Sumitomo Heavy Industries currently trades on a lower than expected P/E since its forecast growth is higher than the wider market. There could be some unobserved threats to earnings preventing the P/E ratio from matching the positive outlook. It appears some are indeed anticipating earnings instability, because these conditions should normally provide a boost to the share price.
It is also worth noting that we have found 2 warning signs for Sumitomo Heavy Industries that you need to take into consideration.
Of course, you might find a fantastic investment by looking at a few good candidates. So take a peek at this free list of companies with a strong growth track record, trading on a low P/E.
New: Manage All Your Stock Portfolios in One Place
We've created the ultimate portfolio companion for stock investors, and it's free.
• Connect an unlimited number of Portfolios and see your total in one currency
• Be alerted to new Warning Signs or Risks via email or mobile
• Track the Fair Value of your stocks
Have feedback on this article? Concerned about the content? Get in touch with us directly. Alternatively, email editorial-team (at) simplywallst.com.
This article by Simply Wall St is general in nature. We provide commentary based on historical data and analyst forecasts only using an unbiased methodology and our articles are not intended to be financial advice. It does not constitute a recommendation to buy or sell any stock, and does not take account of your objectives, or your financial situation. We aim to bring you long-term focused analysis driven by fundamental data. Note that our analysis may not factor in the latest price-sensitive company announcements or qualitative material. Simply Wall St has no position in any stocks mentioned.
About TSE:6302
Sumitomo Heavy Industries
Manufactures and sells general machinery worldwide.
Adequate balance sheet with slight risk.
Similar Companies
Market Insights
Community Narratives


