Should Weakness in Amada Co., Ltd.'s (TSE:6113) Stock Be Seen As A Sign That Market Will Correct The Share Price Given Decent Financials?


It is hard to get excited after looking at Amada's (TSE:6113) recent performance, when its stock has declined 18% over the past three months. But if you pay close attention, you might find that its key financial indicators look quite decent, which could mean that the stock could potentially rise in the long-term given how markets usually reward more resilient long-term fundamentals. Specifically, we decided to study Amada's ROE in this article.
Return on Equity or ROE is a test of how effectively a company is growing its value and managing investors’ money. Put another way, it reveals the company's success at turning shareholder investments into profits.
View our latest analysis for Amada
How Is ROE Calculated?
Return on equity can be calculated by using the formula:
Return on Equity = Net Profit (from continuing operations) ÷ Shareholders' Equity
So, based on the above formula, the ROE for Amada is:
7.0% = JP¥38b ÷ JP¥543b (Based on the trailing twelve months to June 2024).
The 'return' is the profit over the last twelve months. Another way to think of that is that for every ¥1 worth of equity, the company was able to earn ¥0.07 in profit.
Why Is ROE Important For Earnings Growth?
So far, we've learned that ROE is a measure of a company's profitability. Depending on how much of these profits the company reinvests or "retains", and how effectively it does so, we are then able to assess a company’s earnings growth potential. Assuming all else is equal, companies that have both a higher return on equity and higher profit retention are usually the ones that have a higher growth rate when compared to companies that don't have the same features.
A Side By Side comparison of Amada's Earnings Growth And 7.0% ROE
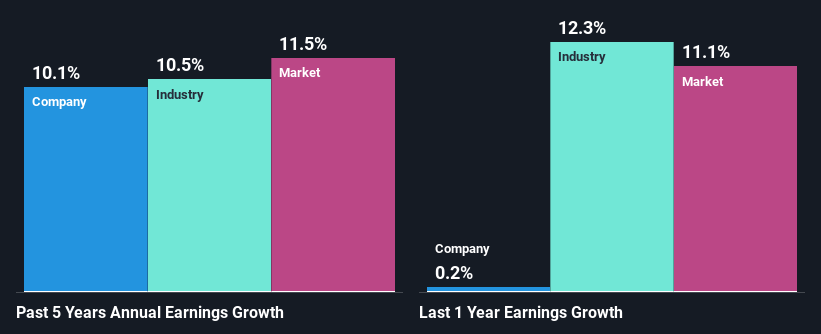
At first glance, Amada's ROE doesn't look very promising. Yet, a closer study shows that the company's ROE is similar to the industry average of 7.3%. On the other hand, Amada reported a moderate 10% net income growth over the past five years. Considering the moderately low ROE, it is quite possible that there might be some other aspects that are positively influencing the company's earnings growth. For instance, the company has a low payout ratio or is being managed efficiently.
We then performed a comparison between Amada's net income growth with the industry, which revealed that the company's growth is similar to the average industry growth of 10% in the same 5-year period.
Earnings growth is an important metric to consider when valuing a stock. It’s important for an investor to know whether the market has priced in the company's expected earnings growth (or decline). This then helps them determine if the stock is placed for a bright or bleak future. What is 6113 worth today? The intrinsic value infographic in our free research report helps visualize whether 6113 is currently mispriced by the market.
Is Amada Using Its Retained Earnings Effectively?
Amada has a healthy combination of a moderate three-year median payout ratio of 47% (or a retention ratio of 53%) and a respectable amount of growth in earnings as we saw above, meaning that the company has been making efficient use of its profits.
Moreover, Amada is determined to keep sharing its profits with shareholders which we infer from its long history of paying a dividend for at least ten years.
Conclusion
In total, it does look like Amada has some positive aspects to its business. With a high rate of reinvestment, albeit at a low ROE, the company has managed to see a considerable growth in its earnings. Having said that, the company's earnings growth is expected to slow down, as forecasted in the current analyst estimates. To know more about the company's future earnings growth forecasts take a look at this free report on analyst forecasts for the company to find out more.
New: Manage All Your Stock Portfolios in One Place
We've created the ultimate portfolio companion for stock investors, and it's free.
• Connect an unlimited number of Portfolios and see your total in one currency
• Be alerted to new Warning Signs or Risks via email or mobile
• Track the Fair Value of your stocks
Have feedback on this article? Concerned about the content? Get in touch with us directly. Alternatively, email editorial-team (at) simplywallst.com.
This article by Simply Wall St is general in nature. We provide commentary based on historical data and analyst forecasts only using an unbiased methodology and our articles are not intended to be financial advice. It does not constitute a recommendation to buy or sell any stock, and does not take account of your objectives, or your financial situation. We aim to bring you long-term focused analysis driven by fundamental data. Note that our analysis may not factor in the latest price-sensitive company announcements or qualitative material. Simply Wall St has no position in any stocks mentioned.
About TSE:6113
Amada
Manufactures, sells, leases, repairs, maintains, checks, and inspects metalworking machinery, software, and peripheral equipment in Japan, North America, Europe, Asia, and internationally.
Flawless balance sheet established dividend payer.

