Miura Co., Ltd.'s (TSE:6005) Stock Is Going Strong: Is the Market Following Fundamentals?


Miura (TSE:6005) has had a great run on the share market with its stock up by a significant 5.2% over the last month. Since the market usually pay for a company’s long-term fundamentals, we decided to study the company’s key performance indicators to see if they could be influencing the market. In this article, we decided to focus on Miura's ROE.
ROE or return on equity is a useful tool to assess how effectively a company can generate returns on the investment it received from its shareholders. Simply put, it is used to assess the profitability of a company in relation to its equity capital.
Check out our latest analysis for Miura
How Do You Calculate Return On Equity?
The formula for return on equity is:
Return on Equity = Net Profit (from continuing operations) ÷ Shareholders' Equity
So, based on the above formula, the ROE for Miura is:
11% = JP¥19b ÷ JP¥182b (Based on the trailing twelve months to March 2024).
The 'return' refers to a company's earnings over the last year. That means that for every ¥1 worth of shareholders' equity, the company generated ¥0.11 in profit.
What Is The Relationship Between ROE And Earnings Growth?
We have already established that ROE serves as an efficient profit-generating gauge for a company's future earnings. We now need to evaluate how much profit the company reinvests or "retains" for future growth which then gives us an idea about the growth potential of the company. Assuming all else is equal, companies that have both a higher return on equity and higher profit retention are usually the ones that have a higher growth rate when compared to companies that don't have the same features.
Miura's Earnings Growth And 11% ROE
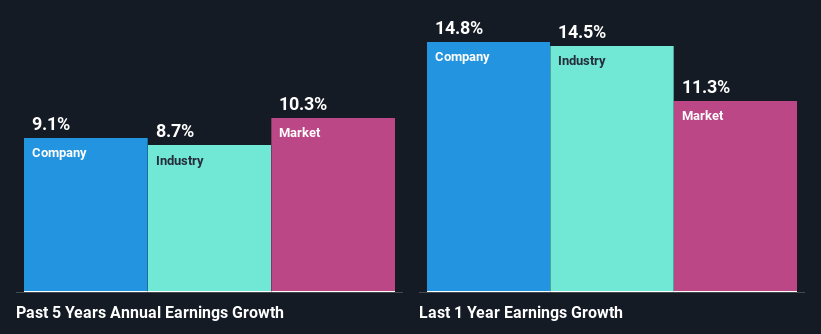
To start with, Miura's ROE looks acceptable. Especially when compared to the industry average of 7.4% the company's ROE looks pretty impressive. Probably as a result of this, Miura was able to see a decent growth of 9.1% over the last five years.
As a next step, we compared Miura's net income growth with the industry and found that the company has a similar growth figure when compared with the industry average growth rate of 8.7% in the same period.
The basis for attaching value to a company is, to a great extent, tied to its earnings growth. The investor should try to establish if the expected growth or decline in earnings, whichever the case may be, is priced in. Doing so will help them establish if the stock's future looks promising or ominous. One good indicator of expected earnings growth is the P/E ratio which determines the price the market is willing to pay for a stock based on its earnings prospects. So, you may want to check if Miura is trading on a high P/E or a low P/E, relative to its industry.
Is Miura Making Efficient Use Of Its Profits?
Miura has a healthy combination of a moderate three-year median payout ratio of 30% (or a retention ratio of 70%) and a respectable amount of growth in earnings as we saw above, meaning that the company has been making efficient use of its profits.
Besides, Miura has been paying dividends for at least ten years or more. This shows that the company is committed to sharing profits with its shareholders.
Summary
On the whole, we feel that Miura's performance has been quite good. Particularly, we like that the company is reinvesting heavily into its business, and at a high rate of return. Unsurprisingly, this has led to an impressive earnings growth. That being so, a study of the latest analyst forecasts show that the company is expected to see a slowdown in its future earnings growth. To know more about the company's future earnings growth forecasts take a look at this free report on analyst forecasts for the company to find out more.
New: Manage All Your Stock Portfolios in One Place
We've created the ultimate portfolio companion for stock investors, and it's free.
• Connect an unlimited number of Portfolios and see your total in one currency
• Be alerted to new Warning Signs or Risks via email or mobile
• Track the Fair Value of your stocks
Have feedback on this article? Concerned about the content? Get in touch with us directly. Alternatively, email editorial-team (at) simplywallst.com.
This article by Simply Wall St is general in nature. We provide commentary based on historical data and analyst forecasts only using an unbiased methodology and our articles are not intended to be financial advice. It does not constitute a recommendation to buy or sell any stock, and does not take account of your objectives, or your financial situation. We aim to bring you long-term focused analysis driven by fundamental data. Note that our analysis may not factor in the latest price-sensitive company announcements or qualitative material. Simply Wall St has no position in any stocks mentioned.
Have feedback on this article? Concerned about the content? Get in touch with us directly. Alternatively, email editorial-team@simplywallst.com
About TSE:6005
Excellent balance sheet with moderate growth potential.

