After Leaping 45% Riken Corundum Company Limited. (TSE:5395) Shares Are Not Flying Under The Radar


Riken Corundum Company Limited. (TSE:5395) shareholders have had their patience rewarded with a 45% share price jump in the last month. The last 30 days bring the annual gain to a very sharp 64%.
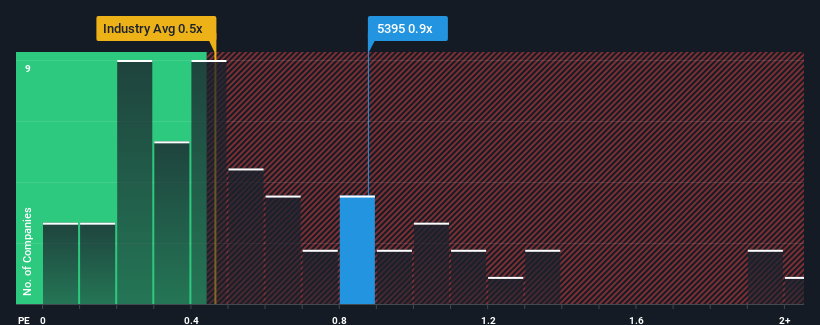
Although its price has surged higher, you could still be forgiven for feeling indifferent about Riken Corundum's P/S ratio of 0.9x, since the median price-to-sales (or "P/S") ratio for the Building industry in Japan is also close to 0.5x. Although, it's not wise to simply ignore the P/S without explanation as investors may be disregarding a distinct opportunity or a costly mistake.
View our latest analysis for Riken Corundum
How Riken Corundum Has Been Performing
For instance, Riken Corundum's receding revenue in recent times would have to be some food for thought. One possibility is that the P/S is moderate because investors think the company might still do enough to be in line with the broader industry in the near future. If you like the company, you'd at least be hoping this is the case so that you could potentially pick up some stock while it's not quite in favour.
Want the full picture on earnings, revenue and cash flow for the company? Then our free report on Riken Corundum will help you shine a light on its historical performance.How Is Riken Corundum's Revenue Growth Trending?
Riken Corundum's P/S ratio would be typical for a company that's only expected to deliver moderate growth, and importantly, perform in line with the industry.
Retrospectively, the last year delivered a frustrating 1.0% decrease to the company's top line. Regardless, revenue has managed to lift by a handy 19% in aggregate from three years ago, thanks to the earlier period of growth. Accordingly, while they would have preferred to keep the run going, shareholders would be roughly satisfied with the medium-term rates of revenue growth.
Weighing that recent medium-term revenue trajectory against the broader industry's one-year forecast for expansion of 4.3% shows it's about the same on an annualised basis.
In light of this, it's understandable that Riken Corundum's P/S sits in line with the majority of other companies. Apparently shareholders are comfortable to simply hold on assuming the company will continue keeping a low profile.
The Final Word
Riken Corundum's stock has a lot of momentum behind it lately, which has brought its P/S level with the rest of the industry. Typically, we'd caution against reading too much into price-to-sales ratios when settling on investment decisions, though it can reveal plenty about what other market participants think about the company.
As we've seen, Riken Corundum's three-year revenue trends seem to be contributing to its P/S, given they look similar to current industry expectations. With previous revenue trends that keep up with the current industry outlook, it's hard to justify the company's P/S ratio deviating much from it's current point. If recent medium-term revenue trends continue, it's hard to see the share price moving strongly in either direction in the near future under these circumstances.
Having said that, be aware Riken Corundum is showing 2 warning signs in our investment analysis, you should know about.
Of course, profitable companies with a history of great earnings growth are generally safer bets. So you may wish to see this free collection of other companies that have reasonable P/E ratios and have grown earnings strongly.
New: AI Stock Screener & Alerts
Our new AI Stock Screener scans the market every day to uncover opportunities.
• Dividend Powerhouses (3%+ Yield)
• Undervalued Small Caps with Insider Buying
• High growth Tech and AI Companies
Or build your own from over 50 metrics.
Have feedback on this article? Concerned about the content? Get in touch with us directly. Alternatively, email editorial-team (at) simplywallst.com.
This article by Simply Wall St is general in nature. We provide commentary based on historical data and analyst forecasts only using an unbiased methodology and our articles are not intended to be financial advice. It does not constitute a recommendation to buy or sell any stock, and does not take account of your objectives, or your financial situation. We aim to bring you long-term focused analysis driven by fundamental data. Note that our analysis may not factor in the latest price-sensitive company announcements or qualitative material. Simply Wall St has no position in any stocks mentioned.
About TSE:5395
Riken Corundum
Engages in the manufacture and sale of coated abrasive papers, abrasive cloths and powders, OA equipment parts, and merchandise for personal use in Japan and internationally.
Flawless balance sheet with acceptable track record.
