Stock Analysis
- Japan
- /
- Construction
- /
- TSE:1959
Has Kyudenko Corporation's (TSE:1959) Impressive Stock Performance Got Anything to Do With Its Fundamentals?


Kyudenko (TSE:1959) has had a great run on the share market with its stock up by a significant 17% over the last three months. Given that stock prices are usually aligned with a company's financial performance in the long-term, we decided to study its financial indicators more closely to see if they had a hand to play in the recent price move. Specifically, we decided to study Kyudenko's ROE in this article.
ROE or return on equity is a useful tool to assess how effectively a company can generate returns on the investment it received from its shareholders. Put another way, it reveals the company's success at turning shareholder investments into profits.
View our latest analysis for Kyudenko
How Is ROE Calculated?
The formula for ROE is:
Return on Equity = Net Profit (from continuing operations) ÷ Shareholders' Equity
So, based on the above formula, the ROE for Kyudenko is:
9.7% = JP¥28b ÷ JP¥291b (Based on the trailing twelve months to March 2024).
The 'return' is the profit over the last twelve months. So, this means that for every ¥1 of its shareholder's investments, the company generates a profit of ¥0.10.
What Has ROE Got To Do With Earnings Growth?
So far, we've learned that ROE is a measure of a company's profitability. Based on how much of its profits the company chooses to reinvest or "retain", we are then able to evaluate a company's future ability to generate profits. Assuming everything else remains unchanged, the higher the ROE and profit retention, the higher the growth rate of a company compared to companies that don't necessarily bear these characteristics.
Kyudenko's Earnings Growth And 9.7% ROE
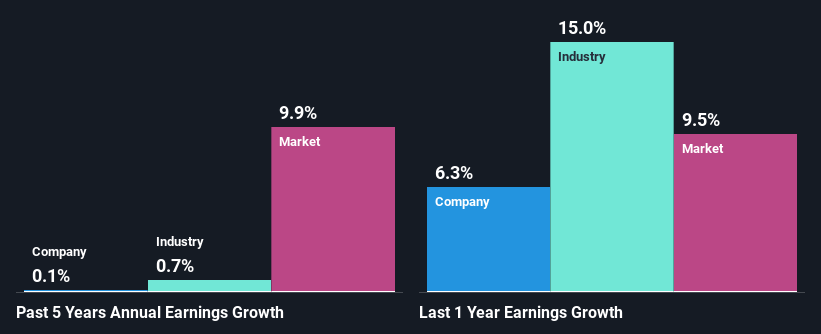
At first glance, Kyudenko seems to have a decent ROE. Especially when compared to the industry average of 6.9% the company's ROE looks pretty impressive. Despite this, Kyudenko's five year net income growth was quite flat over the past five years. Based on this, we feel that there might be other reasons which haven't been discussed so far in this article that could be hampering the company's growth. For example, it could be that the company has a high payout ratio or the business has allocated capital poorly, for instance.
We then compared Kyudenko's net income growth with the industry and found that the company's growth figure is lower than the average industry growth rate of 0.7% in the same 5-year period, which is a bit concerning.
Earnings growth is an important metric to consider when valuing a stock. It’s important for an investor to know whether the market has priced in the company's expected earnings growth (or decline). Doing so will help them establish if the stock's future looks promising or ominous. Is 1959 fairly valued? This infographic on the company's intrinsic value has everything you need to know.
Is Kyudenko Efficiently Re-investing Its Profits?
Despite having a moderate three-year median payout ratio of 28% (meaning the company retains72% of profits) in the last three-year period, Kyudenko's earnings growth was more or les flat. Therefore, there might be some other reasons to explain the lack in that respect. For example, the business could be in decline.
Moreover, Kyudenko has been paying dividends for at least ten years or more suggesting that management must have perceived that the shareholders prefer dividends over earnings growth.
Conclusion
In total, it does look like Kyudenko has some positive aspects to its business. However, given the high ROE and high profit retention, we would expect the company to be delivering strong earnings growth, but that isn't the case here. This suggests that there might be some external threat to the business, that's hampering its growth. Having said that, looking at the current analyst estimates, we found that the company's earnings are expected to gain momentum. To know more about the company's future earnings growth forecasts take a look at this free report on analyst forecasts for the company to find out more.
Valuation is complex, but we're helping make it simple.
Find out whether Kyudenko is potentially over or undervalued by checking out our comprehensive analysis, which includes fair value estimates, risks and warnings, dividends, insider transactions and financial health.
View the Free AnalysisHave feedback on this article? Concerned about the content? Get in touch with us directly. Alternatively, email editorial-team (at) simplywallst.com.
This article by Simply Wall St is general in nature. We provide commentary based on historical data and analyst forecasts only using an unbiased methodology and our articles are not intended to be financial advice. It does not constitute a recommendation to buy or sell any stock, and does not take account of your objectives, or your financial situation. We aim to bring you long-term focused analysis driven by fundamental data. Note that our analysis may not factor in the latest price-sensitive company announcements or qualitative material. Simply Wall St has no position in any stocks mentioned.
About TSE:1959
Kyudenko
Engages in design, construction, and installation of power infrastructure construction business in Japan.
Excellent balance sheet established dividend payer.
