Stock Analysis
- Japan
- /
- Construction
- /
- TSE:1820
Pulling back 5.1% this week, Nishimatsu Construction's TSE:1820) five-year decline in earnings may be coming into investors focus


Stock pickers are generally looking for stocks that will outperform the broader market. Buying under-rated businesses is one path to excess returns. For example, long term Nishimatsu Construction Co., Ltd. (TSE:1820) shareholders have enjoyed a 80% share price rise over the last half decade, well in excess of the market return of around 59% (not including dividends). However, more recent returns haven't been as impressive as that, with the stock returning just 29% in the last year , including dividends .
While this past week has detracted from the company's five-year return, let's look at the recent trends of the underlying business and see if the gains have been in alignment.
View our latest analysis for Nishimatsu Construction
While markets are a powerful pricing mechanism, share prices reflect investor sentiment, not just underlying business performance. One way to examine how market sentiment has changed over time is to look at the interaction between a company's share price and its earnings per share (EPS).
During five years of share price growth, Nishimatsu Construction actually saw its EPS drop 2.1% per year.
By glancing at these numbers, we'd posit that the decline in earnings per share is not representative of how the business has changed over the years. Since the change in EPS doesn't seem to correlate with the change in share price, it's worth taking a look at other metrics.
In fact, the dividend has increased over time, which is a positive. It could be that the company is reaching maturity and dividend investors are buying for the yield.
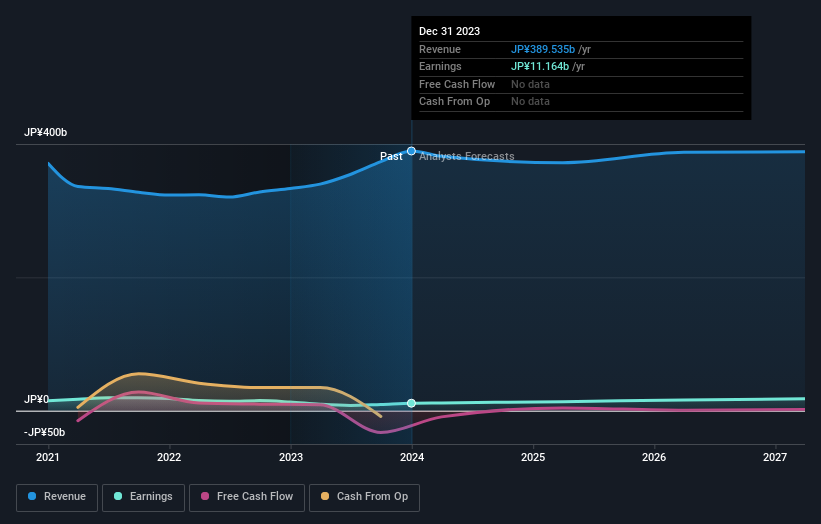
The graphic below depicts how earnings and revenue have changed over time (unveil the exact values by clicking on the image).
This free interactive report on Nishimatsu Construction's balance sheet strength is a great place to start, if you want to investigate the stock further.
What About Dividends?
When looking at investment returns, it is important to consider the difference between total shareholder return (TSR) and share price return. The TSR is a return calculation that accounts for the value of cash dividends (assuming that any dividend received was reinvested) and the calculated value of any discounted capital raisings and spin-offs. It's fair to say that the TSR gives a more complete picture for stocks that pay a dividend. As it happens, Nishimatsu Construction's TSR for the last 5 years was 129%, which exceeds the share price return mentioned earlier. And there's no prize for guessing that the dividend payments largely explain the divergence!
A Different Perspective
Nishimatsu Construction's TSR for the year was broadly in line with the market average, at 29%. That gain looks pretty satisfying, and it is even better than the five-year TSR of 18% per year. It is possible that management foresight will bring growth well into the future, even if the share price slows down. I find it very interesting to look at share price over the long term as a proxy for business performance. But to truly gain insight, we need to consider other information, too. Take risks, for example - Nishimatsu Construction has 2 warning signs (and 1 which is a bit unpleasant) we think you should know about.
If you would prefer to check out another company -- one with potentially superior financials -- then do not miss this free list of companies that have proven they can grow earnings.
Please note, the market returns quoted in this article reflect the market weighted average returns of stocks that currently trade on Japanese exchanges.
Valuation is complex, but we're helping make it simple.
Find out whether Nishimatsu Construction is potentially over or undervalued by checking out our comprehensive analysis, which includes fair value estimates, risks and warnings, dividends, insider transactions and financial health.
View the Free AnalysisHave feedback on this article? Concerned about the content? Get in touch with us directly. Alternatively, email editorial-team (at) simplywallst.com.
This article by Simply Wall St is general in nature. We provide commentary based on historical data and analyst forecasts only using an unbiased methodology and our articles are not intended to be financial advice. It does not constitute a recommendation to buy or sell any stock, and does not take account of your objectives, or your financial situation. We aim to bring you long-term focused analysis driven by fundamental data. Note that our analysis may not factor in the latest price-sensitive company announcements or qualitative material. Simply Wall St has no position in any stocks mentioned.
About TSE:1820
Nishimatsu Construction
Nishimatsu Construction Co., Ltd. engages in the construction, development, real estate, and other businesses in Japan and internationally.
Average dividend payer with mediocre balance sheet.
