- Japan
- /
- Construction
- /
- TSE:1812
Kajima Corporation's (TSE:1812) Fundamentals Look Pretty Strong: Could The Market Be Wrong About The Stock?


Kajima (TSE:1812) has had a rough three months with its share price down 13%. But if you pay close attention, you might gather that its strong financials could mean that the stock could potentially see an increase in value in the long-term, given how markets usually reward companies with good financial health. Specifically, we decided to study Kajima's ROE in this article.
Return on equity or ROE is an important factor to be considered by a shareholder because it tells them how effectively their capital is being reinvested. In short, ROE shows the profit each dollar generates with respect to its shareholder investments.
Check out our latest analysis for Kajima
How Do You Calculate Return On Equity?
The formula for return on equity is:
Return on Equity = Net Profit (from continuing operations) ÷ Shareholders' Equity
So, based on the above formula, the ROE for Kajima is:
9.5% = JP¥117b ÷ JP¥1.2t (Based on the trailing twelve months to March 2024).
The 'return' is the amount earned after tax over the last twelve months. Another way to think of that is that for every ¥1 worth of equity, the company was able to earn ¥0.10 in profit.
What Has ROE Got To Do With Earnings Growth?
So far, we've learned that ROE is a measure of a company's profitability. Based on how much of its profits the company chooses to reinvest or "retain", we are then able to evaluate a company's future ability to generate profits. Assuming everything else remains unchanged, the higher the ROE and profit retention, the higher the growth rate of a company compared to companies that don't necessarily bear these characteristics.
Kajima's Earnings Growth And 9.5% ROE
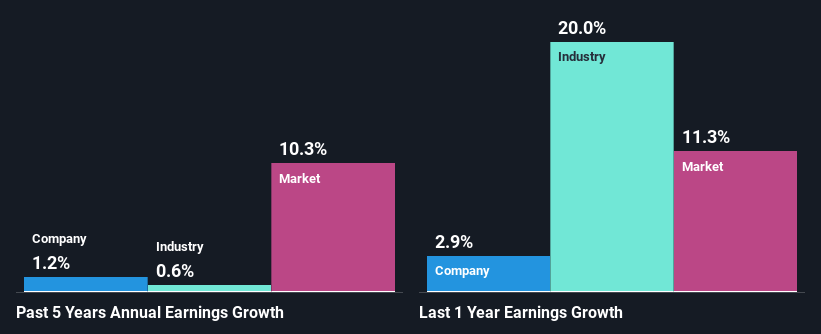
At first glance, Kajima seems to have a decent ROE. On comparing with the average industry ROE of 7.2% the company's ROE looks pretty remarkable. However, we are curious as to how the high returns still resulted in flat growth for Kajima in the past five years. We reckon that there could be some other factors at play here that's limiting the company's growth. Such as, the company pays out a huge portion of its earnings as dividends, or is faced with competitive pressures.
As a next step, we compared Kajima's net income growth with the industry, and pleasingly, we found that the growth seen by the company is higher than the average industry growth of 0.6%.
Earnings growth is an important metric to consider when valuing a stock. What investors need to determine next is if the expected earnings growth, or the lack of it, is already built into the share price. This then helps them determine if the stock is placed for a bright or bleak future. One good indicator of expected earnings growth is the P/E ratio which determines the price the market is willing to pay for a stock based on its earnings prospects. So, you may want to check if Kajima is trading on a high P/E or a low P/E, relative to its industry.
Is Kajima Making Efficient Use Of Its Profits?
Despite having a normal three-year median payout ratio of 29% (implying that the company keeps 71% of its income) over the last three years, Kajima has seen a negligible amount of growth in earnings as we saw above. So there could be some other explanation in that regard. For instance, the company's business may be deteriorating.
Additionally, Kajima has paid dividends over a period of at least ten years, which means that the company's management is determined to pay dividends even if it means little to no earnings growth.
Summary
In total, we are pretty happy with Kajima's performance. In particular, it's great to see that the company is investing heavily into its business and along with a high rate of return, that has resulted in a sizeable growth in its earnings. With that said, the latest industry analyst forecasts reveal that the company's earnings are expected to accelerate. To know more about the latest analysts predictions for the company, check out this visualization of analyst forecasts for the company.
Valuation is complex, but we're here to simplify it.
Discover if Kajima might be undervalued or overvalued with our detailed analysis, featuring fair value estimates, potential risks, dividends, insider trades, and its financial condition.
Access Free AnalysisHave feedback on this article? Concerned about the content? Get in touch with us directly. Alternatively, email editorial-team (at) simplywallst.com.
This article by Simply Wall St is general in nature. We provide commentary based on historical data and analyst forecasts only using an unbiased methodology and our articles are not intended to be financial advice. It does not constitute a recommendation to buy or sell any stock, and does not take account of your objectives, or your financial situation. We aim to bring you long-term focused analysis driven by fundamental data. Note that our analysis may not factor in the latest price-sensitive company announcements or qualitative material. Simply Wall St has no position in any stocks mentioned.
Have feedback on this article? Concerned about the content? Get in touch with us directly. Alternatively, email editorial-team@simplywallst.com
About TSE:1812
Kajima
Engages in civil engineering, building construction, real estate development, architectural design, and other businesses worldwide.
Undervalued established dividend payer.

