Stock Analysis
- Japan
- /
- Trade Distributors
- /
- TSE:1736
Otec Corporation's (TSE:1736) Stock Is Going Strong: Have Financials A Role To Play?


Most readers would already be aware that Otec's (TSE:1736) stock increased significantly by 30% over the past three months. We wonder if and what role the company's financials play in that price change as a company's long-term fundamentals usually dictate market outcomes. Specifically, we decided to study Otec's ROE in this article.
Return on equity or ROE is a key measure used to assess how efficiently a company's management is utilizing the company's capital. In short, ROE shows the profit each dollar generates with respect to its shareholder investments.
See our latest analysis for Otec
How Do You Calculate Return On Equity?
Return on equity can be calculated by using the formula:
Return on Equity = Net Profit (from continuing operations) ÷ Shareholders' Equity
So, based on the above formula, the ROE for Otec is:
9.2% = JP¥1.8b ÷ JP¥19b (Based on the trailing twelve months to December 2023).
The 'return' is the yearly profit. That means that for every ¥1 worth of shareholders' equity, the company generated ¥0.09 in profit.
Why Is ROE Important For Earnings Growth?
Thus far, we have learned that ROE measures how efficiently a company is generating its profits. We now need to evaluate how much profit the company reinvests or "retains" for future growth which then gives us an idea about the growth potential of the company. Generally speaking, other things being equal, firms with a high return on equity and profit retention, have a higher growth rate than firms that don’t share these attributes.
A Side By Side comparison of Otec's Earnings Growth And 9.2% ROE
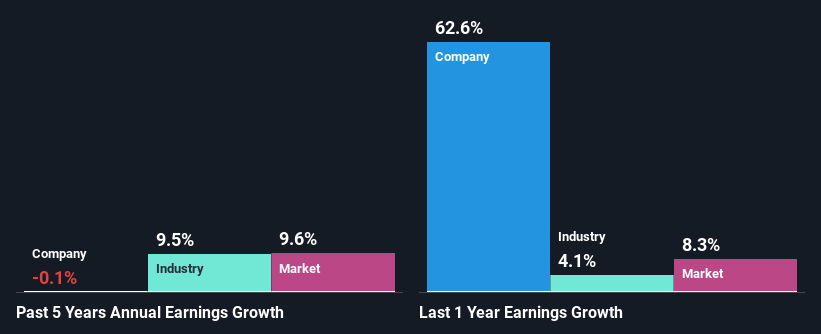
At first glance, Otec seems to have a decent ROE. And on comparing with the industry, we found that the the average industry ROE is similar at 8.1%. Given the circumstances, we can't help but wonder why Otec saw little to no growth in the past five years. We reckon that there could be some other factors at play here that's limiting the company's growth. Such as, the company pays out a huge portion of its earnings as dividends, or is faced with competitive pressures.
As a next step, we compared Otec's net income growth with the industry and discovered that the industry saw an average growth of 9.5% in the same period.
Earnings growth is an important metric to consider when valuing a stock. It’s important for an investor to know whether the market has priced in the company's expected earnings growth (or decline). This then helps them determine if the stock is placed for a bright or bleak future. If you're wondering about Otec's's valuation, check out this gauge of its price-to-earnings ratio, as compared to its industry.
Is Otec Using Its Retained Earnings Effectively?
Despite having a moderate three-year median payout ratio of 33% (meaning the company retains67% of profits) in the last three-year period, Otec's earnings growth was more or les flat. So there might be other factors at play here which could potentially be hampering growth. For example, the business has faced some headwinds.
In addition, Otec has been paying dividends over a period of at least ten years suggesting that keeping up dividend payments is way more important to the management even if it comes at the cost of business growth.
Summary
Overall, we feel that Otec certainly does have some positive factors to consider. Although, we are disappointed to see a lack of growth in earnings even in spite of a high ROE and and a high reinvestment rate. We believe that there might be some outside factors that could be having a negative impact on the business. Up till now, we've only made a short study of the company's growth data. So it may be worth checking this free detailed graph of Otec's past earnings, as well as revenue and cash flows to get a deeper insight into the company's performance.
Valuation is complex, but we're helping make it simple.
Find out whether Otec is potentially over or undervalued by checking out our comprehensive analysis, which includes fair value estimates, risks and warnings, dividends, insider transactions and financial health.
View the Free AnalysisHave feedback on this article? Concerned about the content? Get in touch with us directly. Alternatively, email editorial-team (at) simplywallst.com.
This article by Simply Wall St is general in nature. We provide commentary based on historical data and analyst forecasts only using an unbiased methodology and our articles are not intended to be financial advice. It does not constitute a recommendation to buy or sell any stock, and does not take account of your objectives, or your financial situation. We aim to bring you long-term focused analysis driven by fundamental data. Note that our analysis may not factor in the latest price-sensitive company announcements or qualitative material. Simply Wall St has no position in any stocks mentioned.
About TSE:1736
Flawless balance sheet with proven track record and pays a dividend.
