Aisin (TSE:7259) shares have shown resilience in recent trading, capturing the attention of investors watching Japan's auto components sector. With a solid track record over the past year, the company continues to generate steady interest.
Aisin’s share price has gained strong momentum recently, with a 6.25% rise over the last month and a substantial 23.12% share price return in the past 90 days. Over the longer term, the company’s 1-year total shareholder return of 76.49% and an impressive 3-year total return of 141.54% highlight both recent enthusiasm and sustained outperformance as investors grow increasingly optimistic about its growth prospects in the auto components space.
If you’re keen to see which other auto stocks are keeping pace, take the next step and explore See the full list for free.
These gains prompt a key question for investors: is Aisin still trading below its true worth, or have recent advances in the share price already accounted for the company’s future growth journey?
Advertisement
Price-to-Earnings of 12.1x: Is it justified?
Aisin’s shares currently trade at a price-to-earnings (P/E) ratio of 12.1x, which suggests the market is assigning a modest valuation for each yen of earnings. At the last close price of ¥2,769, these shares appear attractively priced, especially given recent gains.
The price-to-earnings ratio shows how much investors are paying for each yen of the company’s earnings. In the auto components industry, this multiple helps assess whether Aisin’s share price accurately reflects its underlying earnings power and growth outlook.
Right now, Aisin’s P/E of 12.1x is comfortably below the sector average of 15.8x. This makes the stock notably cheaper than its peers. Compared to the estimated fair P/E ratio of 14.5x, the current valuation also appears lower than where it could be if the market were to rerate these shares. If sentiment changes, there is room for the multiple to move higher.
However, persistent revenue growth remains modest, and the recent share price already exceeds analyst targets. This could limit further near-term upside for Aisin’s stock.
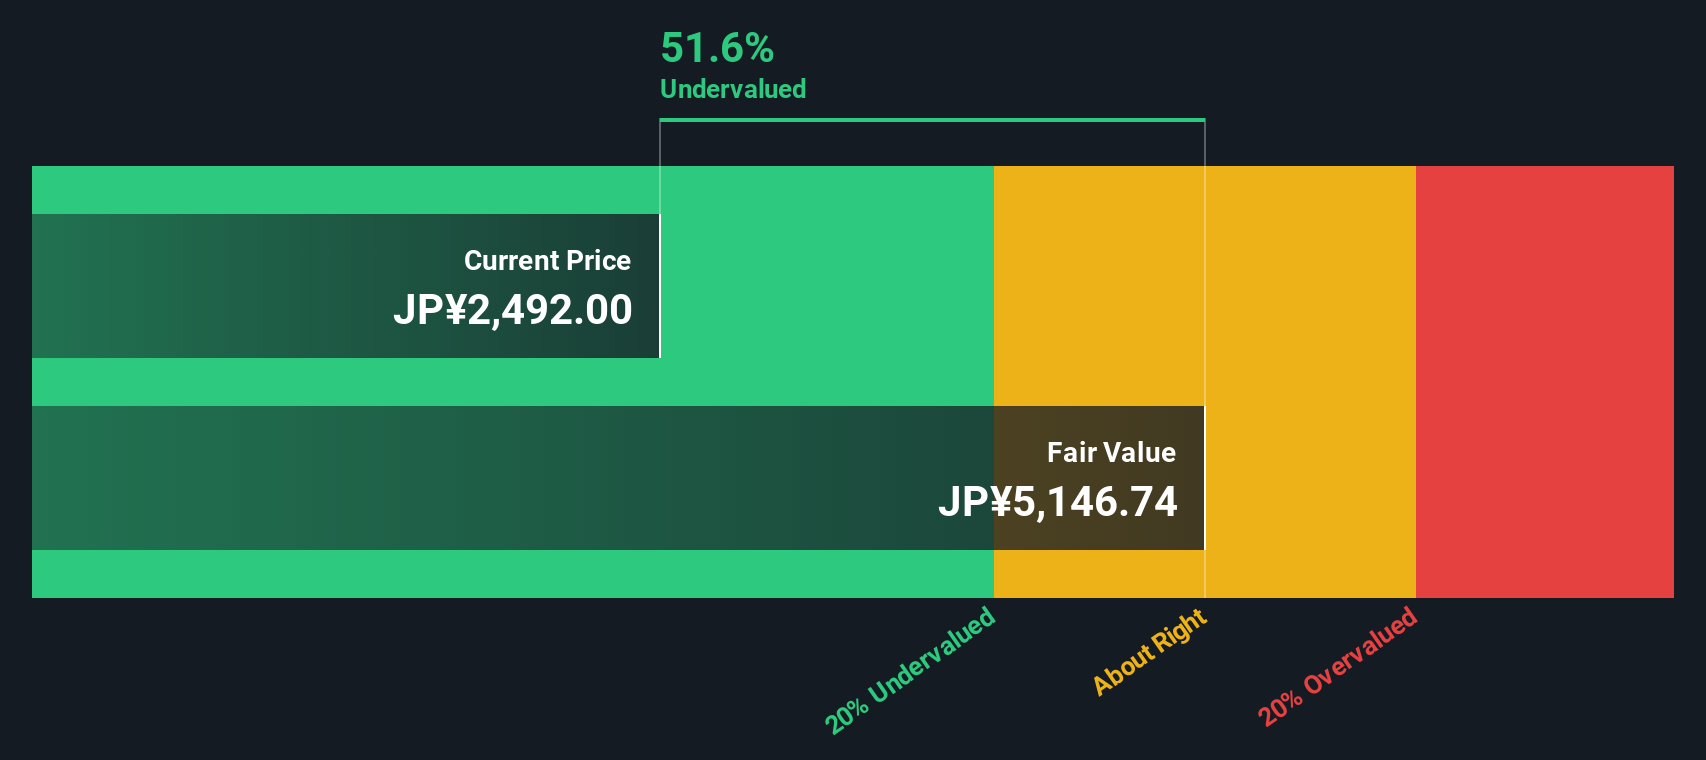
While Aisin’s price-to-earnings ratio suggests the shares are undervalued against peers and the fair ratio, our SWS DCF model offers a much more optimistic picture. According to this method, the stock is currently trading at a 41.2% discount to its estimated fair value.
Simply Wall St performs a discounted cash flow (DCF) on every stock in the world every day (check out Aisin for example). We show the entire calculation in full. You can track the result in your watchlist or portfolio and be alerted when this changes, or use our stock screener to discover 861 undervalued stocks based on their cash flows. If you save a screener we even alert you when new companies match - so you never miss a potential opportunity.
Build Your Own Aisin Narrative
If you see things differently or want to dive deeper into the numbers, you can put together your own take in just a few minutes. Do it your way
Don’t limit your strategy to just one company. Exceptional investing opportunities are waiting, and you’re just a click away from spotting tomorrow’s winners today.
This article by Simply Wall St is general in nature. We provide commentary based on historical data
and analyst forecasts only using an unbiased methodology and our articles are not intended to be financial advice. It does not constitute a recommendation to buy or sell any stock, and does not take account of your objectives, or your
financial situation. We aim to bring you long-term focused analysis driven by fundamental data.
Note that our analysis may not factor in the latest price-sensitive company announcements or qualitative material.
Simply Wall St has no position in any stocks mentioned.
New: Manage All Your Stock Portfolios in One Place
We've created the ultimate portfolio companion for stock investors, and it's free.
• Connect an unlimited number of Portfolios and see your total in one currency • Be alerted to new Warning Signs or Risks via email or mobile • Track the Fair Value of your stocks