- Japan
- /
- Auto Components
- /
- TSE:3569
Seiren Co.,Ltd. (TSE:3569) Stock Has Shown Weakness Lately But Financials Look Strong: Should Prospective Shareholders Make The Leap?


It is hard to get excited after looking at SeirenLtd's (TSE:3569) recent performance, when its stock has declined 17% over the past three months. However, stock prices are usually driven by a company’s financial performance over the long term, which in this case looks quite promising. Specifically, we decided to study SeirenLtd's ROE in this article.
Return on equity or ROE is an important factor to be considered by a shareholder because it tells them how effectively their capital is being reinvested. In simpler terms, it measures the profitability of a company in relation to shareholder's equity.
See our latest analysis for SeirenLtd
How Do You Calculate Return On Equity?
Return on equity can be calculated by using the formula:
Return on Equity = Net Profit (from continuing operations) ÷ Shareholders' Equity
So, based on the above formula, the ROE for SeirenLtd is:
9.8% = JP¥12b ÷ JP¥125b (Based on the trailing twelve months to March 2024).
The 'return' is the yearly profit. One way to conceptualize this is that for each ¥1 of shareholders' capital it has, the company made ¥0.10 in profit.
What Is The Relationship Between ROE And Earnings Growth?
So far, we've learned that ROE is a measure of a company's profitability. We now need to evaluate how much profit the company reinvests or "retains" for future growth which then gives us an idea about the growth potential of the company. Generally speaking, other things being equal, firms with a high return on equity and profit retention, have a higher growth rate than firms that don’t share these attributes.
A Side By Side comparison of SeirenLtd's Earnings Growth And 9.8% ROE
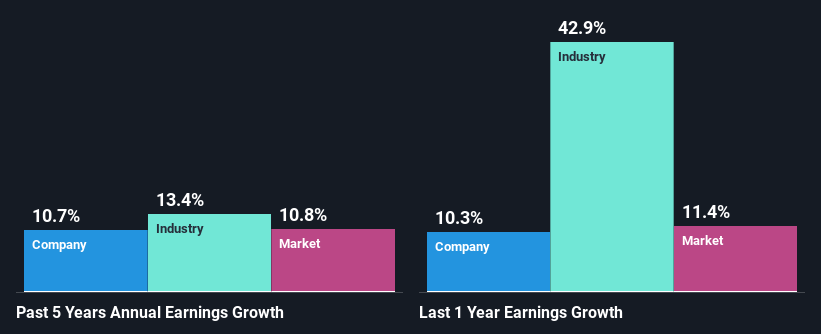
At first glance, SeirenLtd seems to have a decent ROE. Further, the company's ROE compares quite favorably to the industry average of 7.2%. This certainly adds some context to SeirenLtd's decent 11% net income growth seen over the past five years.
As a next step, we compared SeirenLtd's net income growth with the industry and found that the company has a similar growth figure when compared with the industry average growth rate of 13% in the same period.
Earnings growth is a huge factor in stock valuation. The investor should try to establish if the expected growth or decline in earnings, whichever the case may be, is priced in. Doing so will help them establish if the stock's future looks promising or ominous. Is SeirenLtd fairly valued compared to other companies? These 3 valuation measures might help you decide.
Is SeirenLtd Efficiently Re-investing Its Profits?
SeirenLtd has a low three-year median payout ratio of 23%, meaning that the company retains the remaining 77% of its profits. This suggests that the management is reinvesting most of the profits to grow the business.
Besides, SeirenLtd has been paying dividends for at least ten years or more. This shows that the company is committed to sharing profits with its shareholders.
Conclusion
Overall, we are quite pleased with SeirenLtd's performance. Specifically, we like that the company is reinvesting a huge chunk of its profits at a high rate of return. This of course has caused the company to see substantial growth in its earnings. That being so, a study of the latest analyst forecasts show that the company is expected to see a slowdown in its future earnings growth. To know more about the latest analysts predictions for the company, check out this visualization of analyst forecasts for the company.
New: Manage All Your Stock Portfolios in One Place
We've created the ultimate portfolio companion for stock investors, and it's free.
• Connect an unlimited number of Portfolios and see your total in one currency
• Be alerted to new Warning Signs or Risks via email or mobile
• Track the Fair Value of your stocks
Have feedback on this article? Concerned about the content? Get in touch with us directly. Alternatively, email editorial-team (at) simplywallst.com.
This article by Simply Wall St is general in nature. We provide commentary based on historical data and analyst forecasts only using an unbiased methodology and our articles are not intended to be financial advice. It does not constitute a recommendation to buy or sell any stock, and does not take account of your objectives, or your financial situation. We aim to bring you long-term focused analysis driven by fundamental data. Note that our analysis may not factor in the latest price-sensitive company announcements or qualitative material. Simply Wall St has no position in any stocks mentioned.
Have feedback on this article? Concerned about the content? Get in touch with us directly. Alternatively, email editorial-team@simplywallst.com
About TSE:3569
SeirenLtd
Manufactures and markets vehicle parts, textile products, industrial machines, and electronic parts in Japan and internationally.
Flawless balance sheet established dividend payer.
