Stock Analysis
- Italy
- /
- Other Utilities
- /
- BIT:IRE
Iren (BIT:IRE) shareholders have endured a 13% loss from investing in the stock three years ago

For many investors, the main point of stock picking is to generate higher returns than the overall market. But if you try your hand at stock picking, your risk returning less than the market. Unfortunately, that's been the case for longer term Iren SpA (BIT:IRE) shareholders, since the share price is down 26% in the last three years, falling well short of the market decline of around 32%.
So let's have a look and see if the longer term performance of the company has been in line with the underlying business' progress.
See our latest analysis for Iren
While markets are a powerful pricing mechanism, share prices reflect investor sentiment, not just underlying business performance. One way to examine how market sentiment has changed over time is to look at the interaction between a company's share price and its earnings per share (EPS).
Although the share price is down over three years, Iren actually managed to grow EPS by 2.4% per year in that time. This is quite a puzzle, and suggests there might be something temporarily buoying the share price. Or else the company was over-hyped in the past, and so its growth has disappointed.
It's pretty reasonable to suspect the market was previously to bullish on the stock, and has since moderated expectations. Looking to other metrics might better explain the share price change.
Given the healthiness of the dividend payments, we doubt that they've concerned the market. We like that Iren has actually grown its revenue over the last three years. But it's not clear to us why the share price is down. It might be worth diving deeper into the fundamentals, lest an opportunity goes begging.
You can see below how earnings and revenue have changed over time (discover the exact values by clicking on the image).
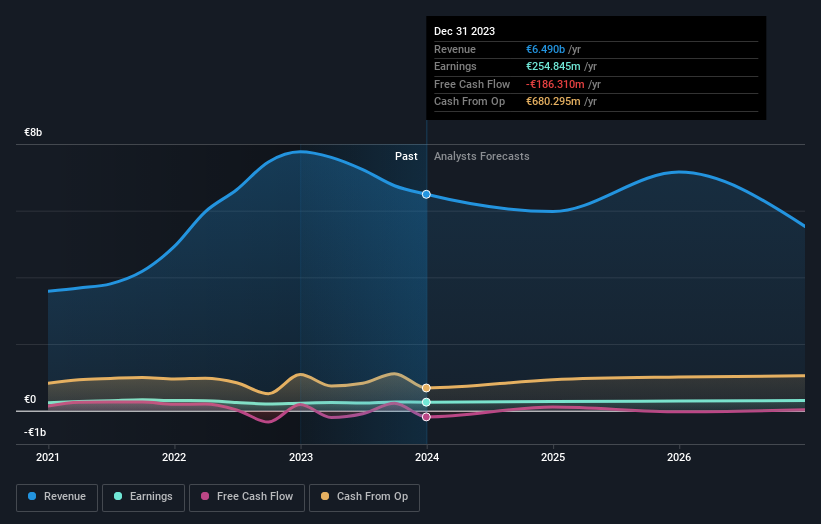
You can see how its balance sheet has strengthened (or weakened) over time in this free interactive graphic.
What About Dividends?
As well as measuring the share price return, investors should also consider the total shareholder return (TSR). The TSR is a return calculation that accounts for the value of cash dividends (assuming that any dividend received was reinvested) and the calculated value of any discounted capital raisings and spin-offs. So for companies that pay a generous dividend, the TSR is often a lot higher than the share price return. We note that for Iren the TSR over the last 3 years was -13%, which is better than the share price return mentioned above. This is largely a result of its dividend payments!
A Different Perspective
Iren shareholders are up 1.3% for the year (even including dividends). Unfortunately this falls short of the market return. On the bright side, the longer term returns (running at about 1.8% a year, over half a decade) look better. It may well be that this is a business worth popping on the watching, given the continuing positive reception, over time, from the market. While it is well worth considering the different impacts that market conditions can have on the share price, there are other factors that are even more important. For instance, we've identified 2 warning signs for Iren (1 makes us a bit uncomfortable) that you should be aware of.
If you like to buy stocks alongside management, then you might just love this free list of companies. (Hint: insiders have been buying them).
Please note, the market returns quoted in this article reflect the market weighted average returns of stocks that currently trade on Italian exchanges.
Valuation is complex, but we're helping make it simple.
Find out whether Iren is potentially over or undervalued by checking out our comprehensive analysis, which includes fair value estimates, risks and warnings, dividends, insider transactions and financial health.
View the Free AnalysisHave feedback on this article? Concerned about the content? Get in touch with us directly. Alternatively, email editorial-team (at) simplywallst.com.
This article by Simply Wall St is general in nature. We provide commentary based on historical data and analyst forecasts only using an unbiased methodology and our articles are not intended to be financial advice. It does not constitute a recommendation to buy or sell any stock, and does not take account of your objectives, or your financial situation. We aim to bring you long-term focused analysis driven by fundamental data. Note that our analysis may not factor in the latest price-sensitive company announcements or qualitative material. Simply Wall St has no position in any stocks mentioned.
About BIT:IRE
Iren
Iren SpA, together with its subsidiaries, operates as a multi-utility company in Italy.
Undervalued established dividend payer.
