Advertisement
- Sweden
- /
- Electrical
- /
- OM:MERIS
Pattern And 2 Other European Penny Stocks To Watch Closely

Simply Wall St
Reviewed by Simply Wall St
As European markets navigate a landscape marked by easing inflation and potential interest rate cuts, investors are keenly observing opportunities that may arise from these economic shifts. While the term 'penny stock' might sound like a relic of past trading days, it still points to intriguing investment prospects within smaller or newer companies. These stocks, when supported by robust financial health, can offer significant potential for growth and stability.
Top 10 Penny Stocks In Europe
| Name | Share Price | Market Cap | Rewards & Risks |
| Bredband2 i Skandinavien (OM:BRE2) | SEK2.33 | SEK2.23B | ✅ 4 ⚠️ 1 View Analysis > |
| KebNi (OM:KEBNI B) | SEK1.93 | SEK523.33M | ✅ 3 ⚠️ 4 View Analysis > |
| Angler Gaming (NGM:ANGL) | SEK3.72 | SEK278.94M | ✅ 4 ⚠️ 2 View Analysis > |
| Hifab Group (OM:HIFA B) | SEK3.44 | SEK209.29M | ✅ 2 ⚠️ 2 View Analysis > |
| Abak (WSE:ABK) | PLN4.20 | PLN11.32M | ✅ 2 ⚠️ 4 View Analysis > |
| Cellularline (BIT:CELL) | €2.95 | €62.22M | ✅ 4 ⚠️ 2 View Analysis > |
| Netgem (ENXTPA:ALNTG) | €0.97 | €32.48M | ✅ 3 ⚠️ 2 View Analysis > |
| Euroland Société anonyme (ENXTPA:MLERO) | €3.26 | €9.49M | ✅ 2 ⚠️ 5 View Analysis > |
| Fondia Oyj (HLSE:FONDIA) | €4.65 | €17.39M | ✅ 2 ⚠️ 3 View Analysis > |
| Deceuninck (ENXTBR:DECB) | €2.125 | €293.39M | ✅ 3 ⚠️ 1 View Analysis > |
Click here to see the full list of 450 stocks from our European Penny Stocks screener.
We'll examine a selection from our screener results.
Pattern (BIT:PTR)
Simply Wall St Financial Health Rating: ★★★★☆☆
Overview: Pattern S.p.A. operates as a luxury engineering and production hub in Italy with a market cap of €70.83 million.
Operations: No revenue segments are reported for this company.
Market Cap: €70.83M
Pattern S.p.A., with a market cap of €70.83 million, recently reported a significant decline in net income to €0.36 million for 2024, down from €23.38 million the previous year, highlighting challenges in maintaining profit margins which fell from 14.4% to 0.3%. Despite this, earnings are forecasted to grow at nearly 20% annually and the company has not diluted shareholders recently. However, its debt-to-equity ratio increased over five years and interest coverage remains weak at 1.3 times EBIT, raising concerns about financial stability amidst volatile earnings performance in the luxury sector.
- Click here and access our complete financial health analysis report to understand the dynamics of Pattern.
- Learn about Pattern's future growth trajectory here.
Libertas 7 (BME:LIB)
Simply Wall St Financial Health Rating: ★★★★☆☆
Overview: Libertas 7, S.A. operates in the real estate and investment sectors in Spain with a market cap of €38.14 million.
Operations: The company's revenue is derived from three main segments: Investments (€2.65 million), Touristic Area (€1.84 million), and Real Estate Area (€1.03 million).
Market Cap: €38.14M
Libertas 7, S.A., with a market cap of €38.14 million, has transitioned to profitability over the past year, though its earnings are impacted by large one-off gains. The company maintains a strong balance sheet with cash exceeding total debt and short-term assets covering both short and long-term liabilities. Despite this financial stability, the company's interest coverage is below optimal levels at 2.7 times EBIT, and it recently reported a net loss of €0.435 million for Q1 2025. Additionally, Libertas 7's share price has been highly volatile recently following a significant stock split in late 2024.
- Jump into the full analysis health report here for a deeper understanding of Libertas 7.
- Evaluate Libertas 7's historical performance by accessing our past performance report.

Meriaura Group Oyj (OM:MERIS)
Simply Wall St Financial Health Rating: ★★★★☆☆
Overview: Meriaura Group Oyj, with a market cap of SEK1.19 billion, designs and delivers solar thermal systems in Europe and internationally through its subsidiaries.
Operations: The company generates revenue from its Building Materials - HVAC Equipment segment, amounting to €79.16 million.
Market Cap: SEK1.19B
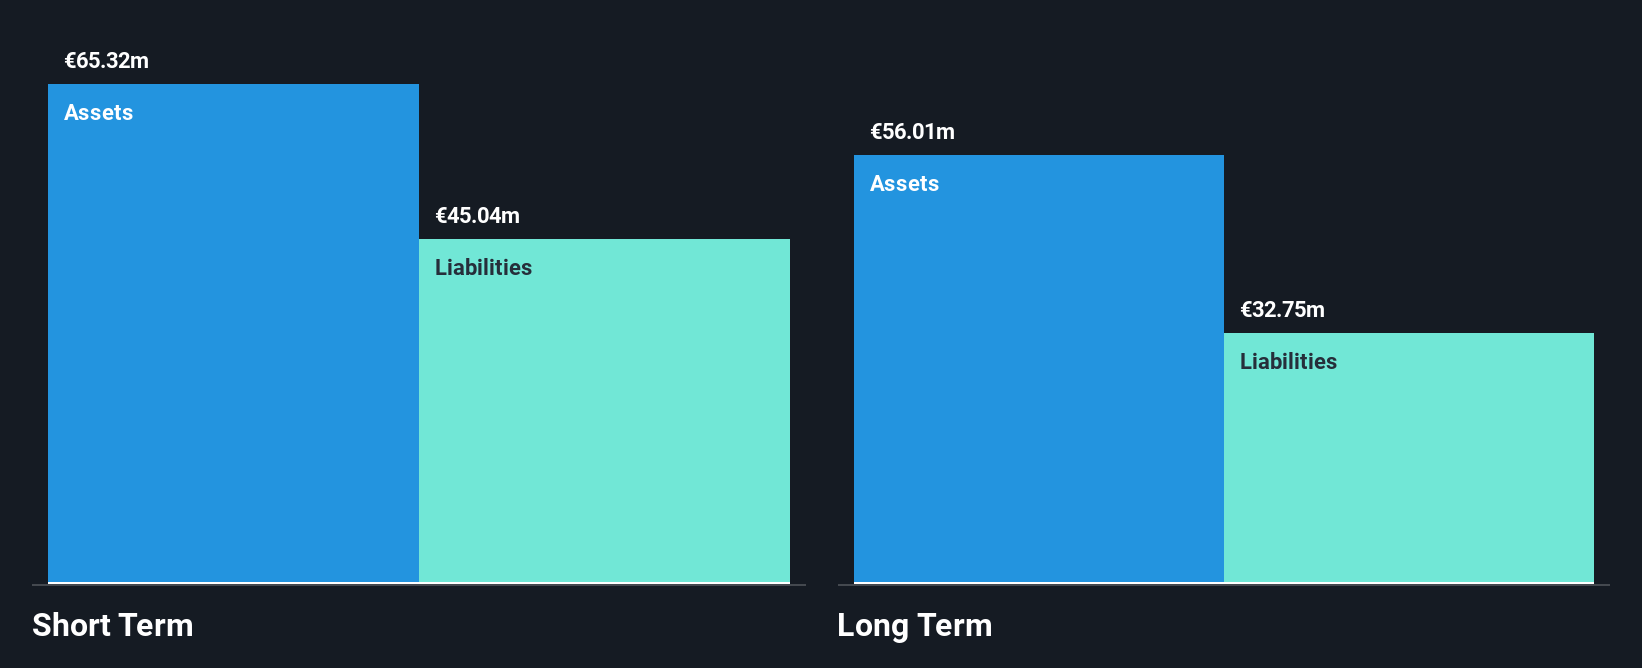
Meriaura Group Oyj, with a market cap of SEK1.19 billion, is undergoing significant changes, including a merger with Summa Defence Oy and updates to its corporate bylaws. Despite being unprofitable, the company has reduced losses by 4.1% annually over five years and maintains a satisfactory net debt to equity ratio of 26%. Its short-term assets (€19.7M) comfortably cover both short-term (€11.5M) and long-term liabilities (€14.7M). However, the board's inexperience and increased share price volatility remain concerns for investors considering this penny stock opportunity in Europe.
- Click to explore a detailed breakdown of our findings in Meriaura Group Oyj's financial health report.
- Gain insights into Meriaura Group Oyj's outlook and expected performance with our report on the company's earnings estimates.
Where To Now?
- Unlock our comprehensive list of 450 European Penny Stocks by clicking here.
- Ready To Venture Into Other Investment Styles? Diversify your portfolio with solid dividend payers offering reliable income streams to weather potential market turbulence.
This article by Simply Wall St is general in nature. We provide commentary based on historical data and analyst forecasts only using an unbiased methodology and our articles are not intended to be financial advice. It does not constitute a recommendation to buy or sell any stock, and does not take account of your objectives, or your financial situation. We aim to bring you long-term focused analysis driven by fundamental data. Note that our analysis may not factor in the latest price-sensitive company announcements or qualitative material. Simply Wall St has no position in any stocks mentioned.
New: Manage All Your Stock Portfolios in One Place
We've created the ultimate portfolio companion for stock investors, and it's free.
• Connect an unlimited number of Portfolios and see your total in one currency
• Be alerted to new Warning Signs or Risks via email or mobile
• Track the Fair Value of your stocks
Have feedback on this article? Concerned about the content? Get in touch with us directly. Alternatively, email editorial-team@simplywallst.com
About OM:MERIS
Meriaura Group Oyj
Designs and delivers solar thermal systems in Europe and internationally.
Reasonable growth potential with adequate balance sheet.
Market Insights

Advertisement
Community Narratives
The "Molecular Pencil": Why Beam's Technology is Built to Win
Fair Value US$65.01|65.4% undervalued
DA
Community Contributor
The silent giant behind virtually every advanced chip powering AI, smartphones, and modern infrastructure.
Fair Value US$310.00|6.1% undervalued
OS
Community Contributor
ADP Stock: Solid Fundamentals, But AI Investments Test Its Margin Resilience
Fair Value US$387.77|34.2% undervalued
YI
Community Contributor
MINISO's fair value is projected at 26.69 with an anticipated PE ratio shift of 20x
Fair Value US$24.03|9.6% undervalued
BE
Community Contributor