Sciuker Frames' (BIT:SCK) 39% CAGR outpaced the company's earnings growth over the same five-year period


Some Sciuker Frames S.p.A. (BIT:SCK) shareholders are probably rather concerned to see the share price fall 34% over the last three months. But that doesn't undermine the fantastic longer term performance (measured over five years). Indeed, the share price is up a whopping 374% in that time. Arguably, the recent fall is to be expected after such a strong rise. Of course what matters most is whether the business can improve itself sustainably, thus justifying a higher price.
Since the stock has added €11m to its market cap in the past week alone, let's see if underlying performance has been driving long-term returns.
See our latest analysis for Sciuker Frames
There is no denying that markets are sometimes efficient, but prices do not always reflect underlying business performance. One way to examine how market sentiment has changed over time is to look at the interaction between a company's share price and its earnings per share (EPS).
Over half a decade, Sciuker Frames managed to grow its earnings per share at 80% a year. The EPS growth is more impressive than the yearly share price gain of 36% over the same period. Therefore, it seems the market has become relatively pessimistic about the company. The reasonably low P/E ratio of 4.22 also suggests market apprehension.
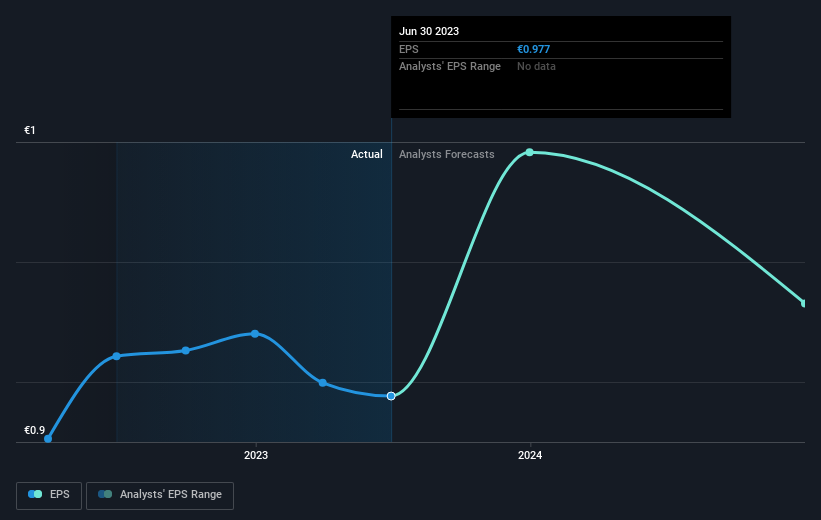
You can see below how EPS has changed over time (discover the exact values by clicking on the image).
We know that Sciuker Frames has improved its bottom line over the last three years, but what does the future have in store? It might be well worthwhile taking a look at our free report on how its financial position has changed over time.
What About Dividends?
It is important to consider the total shareholder return, as well as the share price return, for any given stock. The TSR incorporates the value of any spin-offs or discounted capital raisings, along with any dividends, based on the assumption that the dividends are reinvested. Arguably, the TSR gives a more comprehensive picture of the return generated by a stock. In the case of Sciuker Frames, it has a TSR of 420% for the last 5 years. That exceeds its share price return that we previously mentioned. This is largely a result of its dividend payments!
A Different Perspective
Investors in Sciuker Frames had a tough year, with a total loss of 43% (including dividends), against a market gain of about 18%. Even the share prices of good stocks drop sometimes, but we want to see improvements in the fundamental metrics of a business, before getting too interested. On the bright side, long term shareholders have made money, with a gain of 39% per year over half a decade. It could be that the recent sell-off is an opportunity, so it may be worth checking the fundamental data for signs of a long term growth trend. I find it very interesting to look at share price over the long term as a proxy for business performance. But to truly gain insight, we need to consider other information, too. Consider for instance, the ever-present spectre of investment risk. We've identified 4 warning signs with Sciuker Frames (at least 2 which are a bit unpleasant) , and understanding them should be part of your investment process.
If you like to buy stocks alongside management, then you might just love this free list of companies. (Hint: insiders have been buying them).
Please note, the market returns quoted in this article reflect the market weighted average returns of stocks that currently trade on Italian exchanges.
New: Manage All Your Stock Portfolios in One Place
We've created the ultimate portfolio companion for stock investors, and it's free.
• Connect an unlimited number of Portfolios and see your total in one currency
• Be alerted to new Warning Signs or Risks via email or mobile
• Track the Fair Value of your stocks
Have feedback on this article? Concerned about the content? Get in touch with us directly. Alternatively, email editorial-team (at) simplywallst.com.
This article by Simply Wall St is general in nature. We provide commentary based on historical data and analyst forecasts only using an unbiased methodology and our articles are not intended to be financial advice. It does not constitute a recommendation to buy or sell any stock, and does not take account of your objectives, or your financial situation. We aim to bring you long-term focused analysis driven by fundamental data. Note that our analysis may not factor in the latest price-sensitive company announcements or qualitative material. Simply Wall St has no position in any stocks mentioned.
About BIT:SCK
Sciuker Frames
Designs and manufactures wood-aluminum and wood-structural glass windows in Italy.
Flawless balance sheet slight.
