- India
- /
- Transportation
- /
- NSEI:DRSDILIP
Are DRS Dilip Roadlines Limited's (NSE:DRSDILIP) Fundamentals Good Enough to Warrant Buying Given The Stock's Recent Weakness?


With its stock down 22% over the past week, it is easy to disregard DRS Dilip Roadlines (NSE:DRSDILIP). But if you pay close attention, you might find that its key financial indicators look quite decent, which could mean that the stock could potentially rise in the long-term given how markets usually reward more resilient long-term fundamentals. Specifically, we decided to study DRS Dilip Roadlines' ROE in this article.
Return on equity or ROE is a key measure used to assess how efficiently a company's management is utilizing the company's capital. Simply put, it is used to assess the profitability of a company in relation to its equity capital.
Check out our latest analysis for DRS Dilip Roadlines
How Do You Calculate Return On Equity?
The formula for return on equity is:
Return on Equity = Net Profit (from continuing operations) ÷ Shareholders' Equity
So, based on the above formula, the ROE for DRS Dilip Roadlines is:
11% = ₹30m ÷ ₹279m (Based on the trailing twelve months to March 2024).
The 'return' is the amount earned after tax over the last twelve months. So, this means that for every ₹1 of its shareholder's investments, the company generates a profit of ₹0.11.
Why Is ROE Important For Earnings Growth?
We have already established that ROE serves as an efficient profit-generating gauge for a company's future earnings. We now need to evaluate how much profit the company reinvests or "retains" for future growth which then gives us an idea about the growth potential of the company. Generally speaking, other things being equal, firms with a high return on equity and profit retention, have a higher growth rate than firms that don’t share these attributes.
A Side By Side comparison of DRS Dilip Roadlines' Earnings Growth And 11% ROE
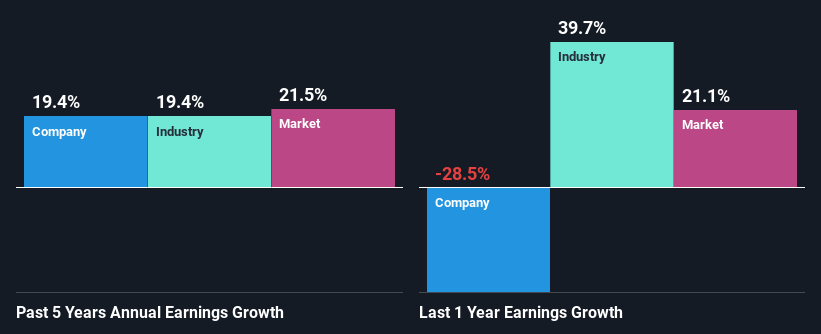
When you first look at it, DRS Dilip Roadlines' ROE doesn't look that attractive. Yet, a closer study shows that the company's ROE is similar to the industry average of 11%. Having said that, DRS Dilip Roadlines has shown a modest net income growth of 19% over the past five years. Given the slightly low ROE, it is likely that there could be some other aspects that are driving this growth. For instance, the company has a low payout ratio or is being managed efficiently.
Next, on comparing DRS Dilip Roadlines' net income growth with the industry, we found that the company's reported growth is similar to the industry average growth rate of 19% over the last few years.
The basis for attaching value to a company is, to a great extent, tied to its earnings growth. The investor should try to establish if the expected growth or decline in earnings, whichever the case may be, is priced in. By doing so, they will have an idea if the stock is headed into clear blue waters or if swampy waters await. If you're wondering about DRS Dilip Roadlines''s valuation, check out this gauge of its price-to-earnings ratio, as compared to its industry.
Is DRS Dilip Roadlines Making Efficient Use Of Its Profits?
DRS Dilip Roadlines doesn't pay any regular dividends, meaning that all of its profits are being reinvested in the business, which explains the fair bit of earnings growth the company has seen.
Conclusion
On the whole, we do feel that DRS Dilip Roadlines has some positive attributes. Despite its low rate of return, the fact that the company reinvests a very high portion of its profits into its business, no doubt contributed to its high earnings growth. While we won't completely dismiss the company, what we would do, is try to ascertain how risky the business is to make a more informed decision around the company. To know the 2 risks we have identified for DRS Dilip Roadlines visit our risks dashboard for free.
New: Manage All Your Stock Portfolios in One Place
We've created the ultimate portfolio companion for stock investors, and it's free.
• Connect an unlimited number of Portfolios and see your total in one currency
• Be alerted to new Warning Signs or Risks via email or mobile
• Track the Fair Value of your stocks
Have feedback on this article? Concerned about the content? Get in touch with us directly. Alternatively, email editorial-team (at) simplywallst.com.
This article by Simply Wall St is general in nature. We provide commentary based on historical data and analyst forecasts only using an unbiased methodology and our articles are not intended to be financial advice. It does not constitute a recommendation to buy or sell any stock, and does not take account of your objectives, or your financial situation. We aim to bring you long-term focused analysis driven by fundamental data. Note that our analysis may not factor in the latest price-sensitive company announcements or qualitative material. Simply Wall St has no position in any stocks mentioned.
Have feedback on this article? Concerned about the content? Get in touch with us directly. Alternatively, email editorial-team@simplywallst.com
About NSEI:DRSDILIP
Excellent balance sheet and fair value.

