
Advertisement
- India
- /
- Electronic Equipment and Components
- /
- NSEI:PGEL
Estimating The Fair Value Of PG Electroplast Limited (NSE:PGEL)
Key Insights
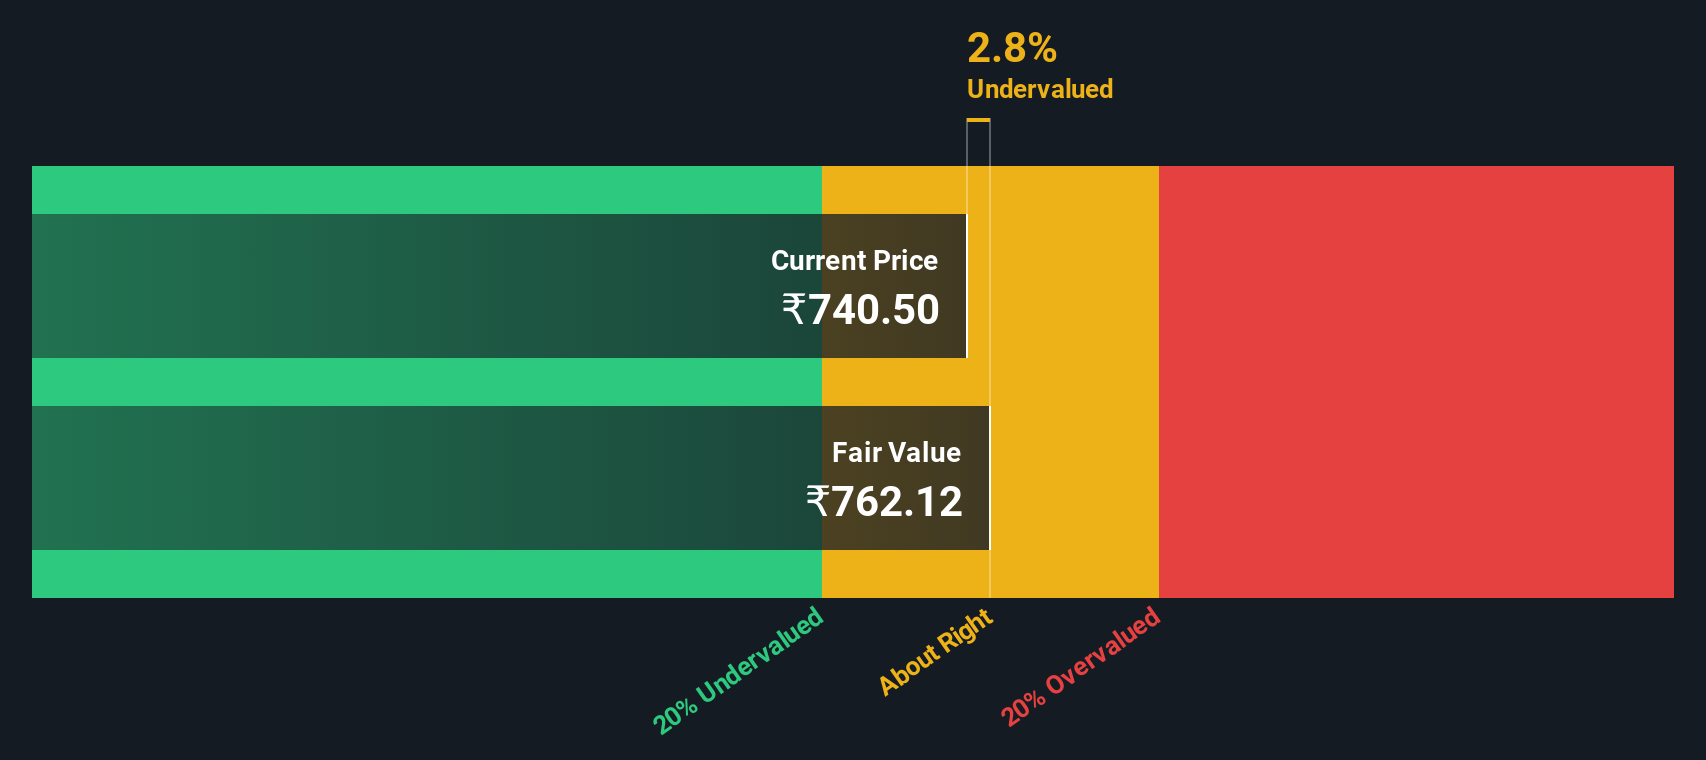
- PG Electroplast's estimated fair value is ₹762 based on 2 Stage Free Cash Flow to Equity
- PG Electroplast's ₹741 share price indicates it is trading at similar levels as its fair value estimate
- Our fair value estimate is 27% lower than PG Electroplast's analyst price target of ₹1,037
Today we'll do a simple run through of a valuation method used to estimate the attractiveness of PG Electroplast Limited (NSE:PGEL) as an investment opportunity by projecting its future cash flows and then discounting them to today's value. One way to achieve this is by employing the Discounted Cash Flow (DCF) model. It may sound complicated, but actually it is quite simple!
We generally believe that a company's value is the present value of all of the cash it will generate in the future. However, a DCF is just one valuation metric among many, and it is not without flaws. Anyone interested in learning a bit more about intrinsic value should have a read of the Simply Wall St analysis model.
The Calculation
We're using the 2-stage growth model, which simply means we take in account two stages of company's growth. In the initial period the company may have a higher growth rate and the second stage is usually assumed to have a stable growth rate. To start off with, we need to estimate the next ten years of cash flows. Where possible we use analyst estimates, but when these aren't available we extrapolate the previous free cash flow (FCF) from the last estimate or reported value. We assume companies with shrinking free cash flow will slow their rate of shrinkage, and that companies with growing free cash flow will see their growth rate slow, over this period. We do this to reflect that growth tends to slow more in the early years than it does in later years.
Generally we assume that a dollar today is more valuable than a dollar in the future, so we need to discount the sum of these future cash flows to arrive at a present value estimate:
10-year free cash flow (FCF) forecast
| 2026 | 2027 | 2028 | 2029 | 2030 | 2031 | 2032 | 2033 | 2034 | 2035 | |
| Levered FCF (₹, Millions) | -₹1.34b | ₹1.84b | ₹5.84b | ₹9.86b | ₹14.8b | ₹20.3b | ₹26.0b | ₹31.6b | ₹37.1b | ₹42.3b |
| Growth Rate Estimate Source | Analyst x3 | Analyst x3 | Analyst x2 | Est @ 68.84% | Est @ 50.21% | Est @ 37.17% | Est @ 28.04% | Est @ 21.65% | Est @ 17.18% | Est @ 14.05% |
| Present Value (₹, Millions) Discounted @ 15% | -₹1.2k | ₹1.4k | ₹3.9k | ₹5.7k | ₹7.5k | ₹9.0k | ₹10.0k | ₹10.6k | ₹10.9k | ₹10.8k |
("Est" = FCF growth rate estimated by Simply Wall St)
Present Value of 10-year Cash Flow (PVCF) = ₹69b
We now need to calculate the Terminal Value, which accounts for all the future cash flows after this ten year period. The Gordon Growth formula is used to calculate Terminal Value at a future annual growth rate equal to the 5-year average of the 10-year government bond yield of 6.7%. We discount the terminal cash flows to today's value at a cost of equity of 15%.
Terminal Value (TV)= FCF2035 × (1 + g) ÷ (r – g) = ₹42b× (1 + 6.7%) ÷ (15%– 6.7%) = ₹575b
Present Value of Terminal Value (PVTV)= TV / (1 + r)10= ₹575b÷ ( 1 + 15%)10= ₹147b
The total value, or equity value, is then the sum of the present value of the future cash flows, which in this case is ₹216b. To get the intrinsic value per share, we divide this by the total number of shares outstanding. Relative to the current share price of ₹741, the company appears about fair value at a 2.8% discount to where the stock price trades currently. The assumptions in any calculation have a big impact on the valuation, so it is better to view this as a rough estimate, not precise down to the last cent.
The Assumptions
Now the most important inputs to a discounted cash flow are the discount rate, and of course, the actual cash flows. Part of investing is coming up with your own evaluation of a company's future performance, so try the calculation yourself and check your own assumptions. The DCF also does not consider the possible cyclicality of an industry, or a company's future capital requirements, so it does not give a full picture of a company's potential performance. Given that we are looking at PG Electroplast as potential shareholders, the cost of equity is used as the discount rate, rather than the cost of capital (or weighted average cost of capital, WACC) which accounts for debt. In this calculation we've used 15%, which is based on a levered beta of 1.082. Beta is a measure of a stock's volatility, compared to the market as a whole. We get our beta from the industry average beta of globally comparable companies, with an imposed limit between 0.8 and 2.0, which is a reasonable range for a stable business.
Check out our latest analysis for PG Electroplast
SWOT Analysis for PG Electroplast
Strength
- Earnings growth over the past year exceeded the industry.
- Debt is well covered by earnings.
Weakness
- Dividend is low compared to the top 25% of dividend payers in the Electronic market.
Opportunity
- Annual earnings are forecast to grow faster than the Indian market.
- Current share price is below our estimate of fair value.
Threat
- Debt is not well covered by operating cash flow.
Next Steps:
Although the valuation of a company is important, it ideally won't be the sole piece of analysis you scrutinize for a company. The DCF model is not a perfect stock valuation tool. Preferably you'd apply different cases and assumptions and see how they would impact the company's valuation. For example, changes in the company's cost of equity or the risk free rate can significantly impact the valuation. For PG Electroplast, we've compiled three additional elements you should consider:
- Risks: To that end, you should be aware of the 1 warning sign we've spotted with PG Electroplast .
- Future Earnings: How does PGEL's growth rate compare to its peers and the wider market? Dig deeper into the analyst consensus number for the upcoming years by interacting with our free analyst growth expectation chart.
- Other High Quality Alternatives: Do you like a good all-rounder? Explore our interactive list of high quality stocks to get an idea of what else is out there you may be missing!
PS. Simply Wall St updates its DCF calculation for every Indian stock every day, so if you want to find the intrinsic value of any other stock just search here.
New: Manage All Your Stock Portfolios in One Place
We've created the ultimate portfolio companion for stock investors, and it's free.
• Connect an unlimited number of Portfolios and see your total in one currency
• Be alerted to new Warning Signs or Risks via email or mobile
• Track the Fair Value of your stocks
Have feedback on this article? Concerned about the content? Get in touch with us directly. Alternatively, email editorial-team (at) simplywallst.com.
This article by Simply Wall St is general in nature. We provide commentary based on historical data and analyst forecasts only using an unbiased methodology and our articles are not intended to be financial advice. It does not constitute a recommendation to buy or sell any stock, and does not take account of your objectives, or your financial situation. We aim to bring you long-term focused analysis driven by fundamental data. Note that our analysis may not factor in the latest price-sensitive company announcements or qualitative material. Simply Wall St has no position in any stocks mentioned.
About NSEI:PGEL
PG Electroplast
Provides electronic manufacturing services for original equipment manufacturers in India and internationally.
High growth potential with excellent balance sheet.
Similar Companies
Market Insights

Advertisement
Community Narratives
The "Molecular Pencil": Why Beam's Technology is Built to Win
Fair Value US$65.01|65.4% undervalued
DA
Community Contributor
The silent giant behind virtually every advanced chip powering AI, smartphones, and modern infrastructure.
Fair Value US$310.00|6.1% undervalued
OS
Community Contributor
ADP Stock: Solid Fundamentals, But AI Investments Test Its Margin Resilience
Fair Value US$387.77|34.2% undervalued
YI
Community Contributor
MINISO's fair value is projected at 26.69 with an anticipated PE ratio shift of 20x
Fair Value US$24.03|9.6% undervalued
BE
Community Contributor