
Advertisement
Tech Mahindra (NSE:TECHM) Full Year 2025 Results
Key Financial Results
- Revenue: ₹529.9b (up 1.9% from FY 2024).
- Net income: ₹42.5b (up 80% from FY 2024).
- Profit margin: 8.0% (up from 4.5% in FY 2024). The increase in margin was primarily driven by higher revenue.
- EPS: ₹48.00 (up from ₹26.66 in FY 2024).
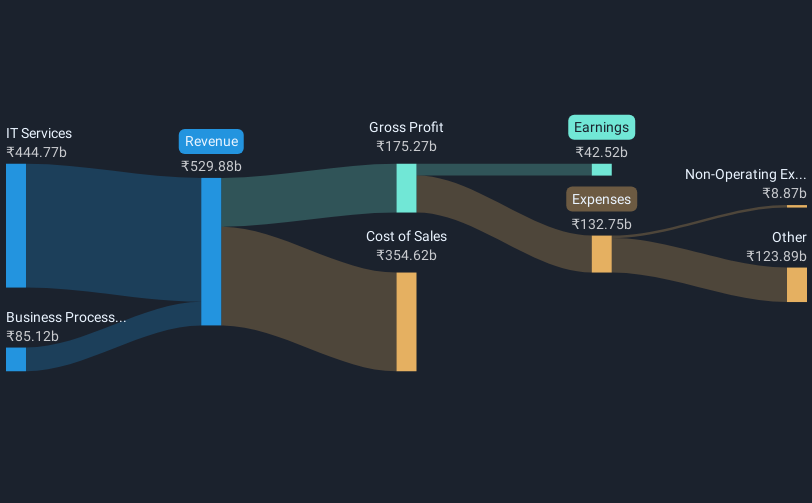
All figures shown in the chart above are for the trailing 12 month (TTM) period
Tech Mahindra EPS Beats Expectations
Revenue was in line with analyst estimates. Earnings per share (EPS) surpassed analyst estimates by 1.7%.
The primary driver behind last 12 months revenue was the IT Services segment contributing a total revenue of ₹444.8b (84% of total revenue). Notably, cost of sales worth ₹354.6b amounted to 67% of total revenue thereby underscoring the impact on earnings.Explore how TECHM's revenue and expenses shape its earnings.
Looking ahead, revenue is forecast to grow 6.0% p.a. on average during the next 3 years, compared to a 6.4% growth forecast for the IT industry in India.
Performance of the Indian IT industry.
The company's shares are up 12% from a week ago.
Risk Analysis
What about risks? Every company has them, and we've spotted 1 warning sign for Tech Mahindra you should know about.
Valuation is complex, but we're here to simplify it.
Discover if Tech Mahindra might be undervalued or overvalued with our detailed analysis, featuring fair value estimates, potential risks, dividends, insider trades, and its financial condition.
Access Free AnalysisHave feedback on this article? Concerned about the content? Get in touch with us directly. Alternatively, email editorial-team (at) simplywallst.com.
This article by Simply Wall St is general in nature. We provide commentary based on historical data and analyst forecasts only using an unbiased methodology and our articles are not intended to be financial advice. It does not constitute a recommendation to buy or sell any stock, and does not take account of your objectives, or your financial situation. We aim to bring you long-term focused analysis driven by fundamental data. Note that our analysis may not factor in the latest price-sensitive company announcements or qualitative material. Simply Wall St has no position in any stocks mentioned.
About NSEI:TECHM
Tech Mahindra
Provides information technology services and solutions in the Americas, Europe, India, and internationally.
Flawless balance sheet established dividend payer.
Similar Companies
Market Insights

Advertisement
Community Narratives
The "Molecular Pencil": Why Beam's Technology is Built to Win
Fair Value US$65.01|65.4% undervalued
DA
Community Contributor
The silent giant behind virtually every advanced chip powering AI, smartphones, and modern infrastructure.
Fair Value US$310.00|6.1% undervalued
OS
Community Contributor
ADP Stock: Solid Fundamentals, But AI Investments Test Its Margin Resilience
Fair Value US$387.77|34.2% undervalued
YI
Community Contributor
MINISO's fair value is projected at 26.69 with an anticipated PE ratio shift of 20x
Fair Value US$24.03|9.6% undervalued
BE
Community Contributor