
Advertisement
Shareholders Are Loving Tech Mahindra Limited's (NSE:TECHM) 1.6% Yield
Could Tech Mahindra Limited (NSE:TECHM) be an attractive dividend share to own for the long haul? Investors are often drawn to strong companies with the idea of reinvesting the dividends. Unfortunately, it's common for investors to be enticed in by the seemingly attractive yield, and lose money when the company has to cut its dividend payments.
A 1.6% yield is nothing to get excited about, but investors probably think the long payment history suggests Tech Mahindra has some staying power. Some simple analysis can offer a lot of insights when buying a company for its dividend, and we'll go through this below.
Explore this interactive chart for our latest analysis on Tech Mahindra!
Payout ratios
Companies (usually) pay dividends out of their earnings. If a company is paying more than it earns, the dividend might have to be cut. So we need to form a view on if a company's dividend is sustainable, relative to its net profit after tax. Tech Mahindra paid out 11% of its profit as dividends, over the trailing twelve month period. With a low payout ratio, it looks like the dividend is comprehensively covered by earnings.
In addition to comparing dividends against profits, we should inspect whether the company generated enough cash to pay its dividend. Tech Mahindra's cash payout ratio last year was 22%. Cash flows are typically lumpy, but this looks like an appropriately conservative payout. It's encouraging to see that the dividend is covered by both profit and cash flow. This generally suggests the dividend is sustainable, as long as earnings don't drop precipitously.
While the above analysis focuses on dividends relative to a company's earnings, we do note Tech Mahindra's strong net cash position, which will let it pay larger dividends for a time, should it choose.
Consider getting our latest analysis on Tech Mahindra's financial position here.
Dividend Volatility
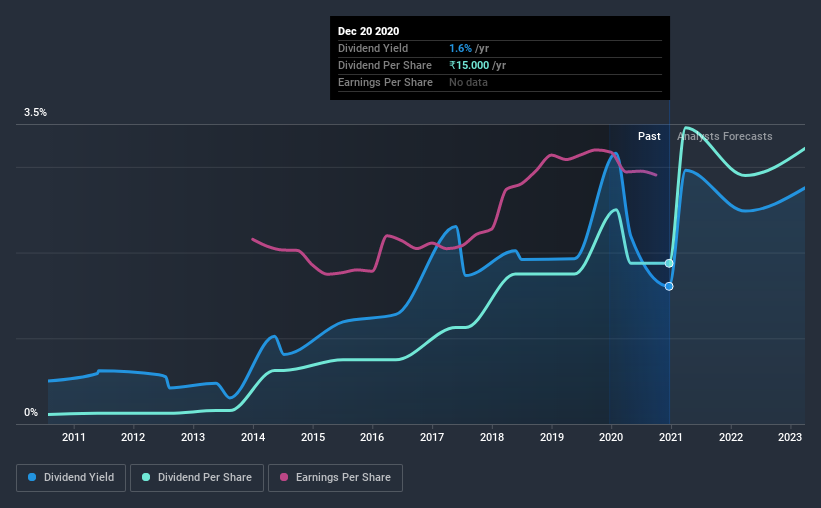
Before buying a stock for its income, we want to see if the dividends have been stable in the past, and if the company has a track record of maintaining its dividend. Tech Mahindra has been paying dividends for a long time, but for the purpose of this analysis, we only examine the past 10 years of payments. The dividend has been cut on at least one occasion historically. During the past 10-year period, the first annual payment was ₹0.9 in 2010, compared to ₹15.0 last year. Dividends per share have grown at approximately 33% per year over this time. The growth in dividends has not been linear, but the CAGR is a decent approximation of the rate of change over this time frame.
Tech Mahindra has grown distributions at a rapid rate despite cutting the dividend at least once in the past. Companies that cut once often cut again, but it might be worth considering if the business has turned a corner.
Dividend Growth Potential
Given that the dividend has been cut in the past, we need to check if earnings are growing and if that might lead to stronger dividends in the future. It's good to see Tech Mahindra has been growing its earnings per share at 10% a year over the past five years. Earnings per share are growing at a solid clip, and the payout ratio is low. We think this is an ideal combination in a dividend stock.
Conclusion
To summarise, shareholders should always check that Tech Mahindra's dividends are affordable, that its dividend payments are relatively stable, and that it has decent prospects for growing its earnings and dividend. Firstly, we like that Tech Mahindra has low and conservative payout ratios. We were also glad to see it growing earnings, but it was concerning to see the dividend has been cut at least once in the past. Overall we think Tech Mahindra scores well on our analysis. It's not quite perfect, but we'd definitely be keen to take a closer look.
Market movements attest to how highly valued a consistent dividend policy is compared to one which is more unpredictable. Still, investors need to consider a host of other factors, apart from dividend payments, when analysing a company. For example, we've picked out 2 warning signs for Tech Mahindra that investors should know about before committing capital to this stock.
We have also put together a list of global stocks with a market capitalisation above $1bn and yielding more 3%.
When trading Tech Mahindra or any other investment, use the platform considered by many to be the Professional's Gateway to the Worlds Market, Interactive Brokers. You get the lowest-cost* trading on stocks, options, futures, forex, bonds and funds worldwide from a single integrated account. Promoted
Valuation is complex, but we're here to simplify it.
Discover if Tech Mahindra might be undervalued or overvalued with our detailed analysis, featuring fair value estimates, potential risks, dividends, insider trades, and its financial condition.
Access Free AnalysisThis article by Simply Wall St is general in nature. It does not constitute a recommendation to buy or sell any stock, and does not take account of your objectives, or your financial situation. We aim to bring you long-term focused analysis driven by fundamental data. Note that our analysis may not factor in the latest price-sensitive company announcements or qualitative material. Simply Wall St has no position in any stocks mentioned.
*Interactive Brokers Rated Lowest Cost Broker by StockBrokers.com Annual Online Review 2020
Have feedback on this article? Concerned about the content? Get in touch with us directly. Alternatively, email editorial-team@simplywallst.com.
About NSEI:TECHM
Tech Mahindra
Provides information technology services and solutions in the Americas, Europe, India, and internationally.
Flawless balance sheet established dividend payer.
Similar Companies
Market Insights

Advertisement
Community Narratives
The company that turned a verb into a global necessity and basically runs the modern internet, digital ads, smartphones, maps, and AI.
Fair Value US$300.00|5.1% undervalued
OS
Community Contributor
Flowers Foods Pays A Fair Price For Health
Fair Value US$16.12|27.7% undervalued
NV
Community Contributor
TMX Group will thrive with 33.3% profit margin and enduring market moat
Fair Value CA$49.90|0.2% overvalued
LI
Community Contributor
The "Molecular Pencil": Why Beam's Technology is Built to Win
Fair Value US$65.01|64.4% undervalued
DA
Community Contributor