
Advertisement
Are Robust Financials Driving The Recent Rally In Systango Technologies Limited's (NSE:SYSTANGO) Stock?
Systango Technologies (NSE:SYSTANGO) has had a great run on the share market with its stock up by a significant 24% over the last three months. Since the market usually pay for a company’s long-term fundamentals, we decided to study the company’s key performance indicators to see if they could be influencing the market. In this article, we decided to focus on Systango Technologies' ROE.
Return on equity or ROE is a key measure used to assess how efficiently a company's management is utilizing the company's capital. In short, ROE shows the profit each dollar generates with respect to its shareholder investments.
How Is ROE Calculated?
The formula for return on equity is:
Return on Equity = Net Profit (from continuing operations) ÷ Shareholders' Equity
So, based on the above formula, the ROE for Systango Technologies is:
23% = ₹237m ÷ ₹1.0b (Based on the trailing twelve months to March 2025).
The 'return' is the income the business earned over the last year. One way to conceptualize this is that for each ₹1 of shareholders' capital it has, the company made ₹0.23 in profit.
Check out our latest analysis for Systango Technologies
What Has ROE Got To Do With Earnings Growth?
We have already established that ROE serves as an efficient profit-generating gauge for a company's future earnings. Based on how much of its profits the company chooses to reinvest or "retain", we are then able to evaluate a company's future ability to generate profits. Generally speaking, other things being equal, firms with a high return on equity and profit retention, have a higher growth rate than firms that don’t share these attributes.
Systango Technologies' Earnings Growth And 23% ROE
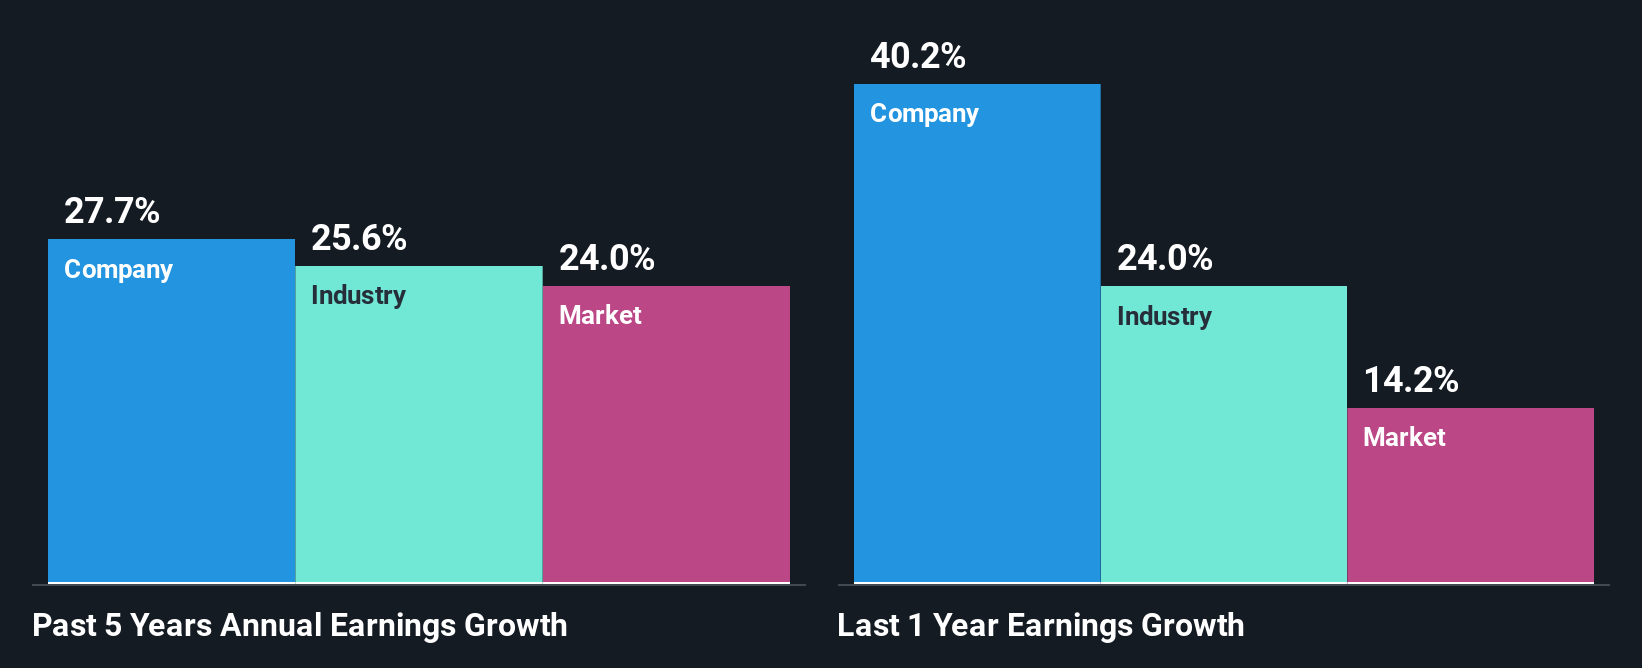
To start with, Systango Technologies' ROE looks acceptable. Especially when compared to the industry average of 16% the company's ROE looks pretty impressive. This probably laid the ground for Systango Technologies' significant 28% net income growth seen over the past five years. However, there could also be other causes behind this growth. Such as - high earnings retention or an efficient management in place.
As a next step, we compared Systango Technologies' net income growth with the industry and found that the company has a similar growth figure when compared with the industry average growth rate of 26% in the same period.
Earnings growth is a huge factor in stock valuation. What investors need to determine next is if the expected earnings growth, or the lack of it, is already built into the share price. By doing so, they will have an idea if the stock is headed into clear blue waters or if swampy waters await. One good indicator of expected earnings growth is the P/E ratio which determines the price the market is willing to pay for a stock based on its earnings prospects. So, you may want to check if Systango Technologies is trading on a high P/E or a low P/E, relative to its industry.
Is Systango Technologies Efficiently Re-investing Its Profits?
Given that Systango Technologies doesn't pay any regular dividends to its shareholders, we infer that the company has been reinvesting all of its profits to grow its business.
Conclusion
On the whole, we feel that Systango Technologies' performance has been quite good. In particular, it's great to see that the company is investing heavily into its business and along with a high rate of return, that has resulted in a sizeable growth in its earnings. If the company continues to grow its earnings the way it has, that could have a positive impact on its share price given how earnings per share influence long-term share prices. Not to forget, share price outcomes are also dependent on the potential risks a company may face. So it is important for investors to be aware of the risks involved in the business. You can see the 2 risks we have identified for Systango Technologies by visiting our risks dashboard for free on our platform here.
New: Manage All Your Stock Portfolios in One Place
We've created the ultimate portfolio companion for stock investors, and it's free.
• Connect an unlimited number of Portfolios and see your total in one currency
• Be alerted to new Warning Signs or Risks via email or mobile
• Track the Fair Value of your stocks
Have feedback on this article? Concerned about the content? Get in touch with us directly. Alternatively, email editorial-team (at) simplywallst.com.
This article by Simply Wall St is general in nature. We provide commentary based on historical data and analyst forecasts only using an unbiased methodology and our articles are not intended to be financial advice. It does not constitute a recommendation to buy or sell any stock, and does not take account of your objectives, or your financial situation. We aim to bring you long-term focused analysis driven by fundamental data. Note that our analysis may not factor in the latest price-sensitive company announcements or qualitative material. Simply Wall St has no position in any stocks mentioned.
About NSEI:SYSTANGO
Systango Technologies
Provides software solutions in India, the United Kingdom, and the United States.
Solid track record with excellent balance sheet.
Similar Companies
Market Insights

Advertisement
Community Narratives
The company that turned a verb into a global necessity and basically runs the modern internet, digital ads, smartphones, maps, and AI.
Fair Value US$300.00|7.1% undervalued
OS
Community Contributor
Flowers Foods Pays A Fair Price For Health
Fair Value US$16.12|26.4% undervalued
NV
Community Contributor
TMX Group will thrive with 33.3% profit margin and enduring market moat
Fair Value CA$49.90|0.8% overvalued
LI
Community Contributor
The "Molecular Pencil": Why Beam's Technology is Built to Win
Fair Value US$65.01|65.8% undervalued
DA
Community Contributor