
Advertisement
- India
- /
- General Merchandise and Department Stores
- /
- NSEI:VAKRANGEE
Can Vakrangee Limited's (NSE:VAKRANGEE) Weak Financials Pull The Plug On The Stock's Current Momentum On Its Share Price?
Most readers would already be aware that Vakrangee's (NSE:VAKRANGEE) stock increased significantly by 10% over the past week. However, we decided to pay close attention to its weak financials as we are doubtful that the current momentum will keep up, given the scenario. Specifically, we decided to study Vakrangee's ROE in this article.
Return on equity or ROE is an important factor to be considered by a shareholder because it tells them how effectively their capital is being reinvested. Simply put, it is used to assess the profitability of a company in relation to its equity capital.
How To Calculate Return On Equity?
ROE can be calculated by using the formula:
Return on Equity = Net Profit (from continuing operations) ÷ Shareholders' Equity
So, based on the above formula, the ROE for Vakrangee is:
3.0% = ₹64m ÷ ₹2.1b (Based on the trailing twelve months to March 2025).
The 'return' is the amount earned after tax over the last twelve months. One way to conceptualize this is that for each ₹1 of shareholders' capital it has, the company made ₹0.03 in profit.
View our latest analysis for Vakrangee
What Is The Relationship Between ROE And Earnings Growth?
We have already established that ROE serves as an efficient profit-generating gauge for a company's future earnings. We now need to evaluate how much profit the company reinvests or "retains" for future growth which then gives us an idea about the growth potential of the company. Generally speaking, other things being equal, firms with a high return on equity and profit retention, have a higher growth rate than firms that don’t share these attributes.
Vakrangee's Earnings Growth And 3.0% ROE
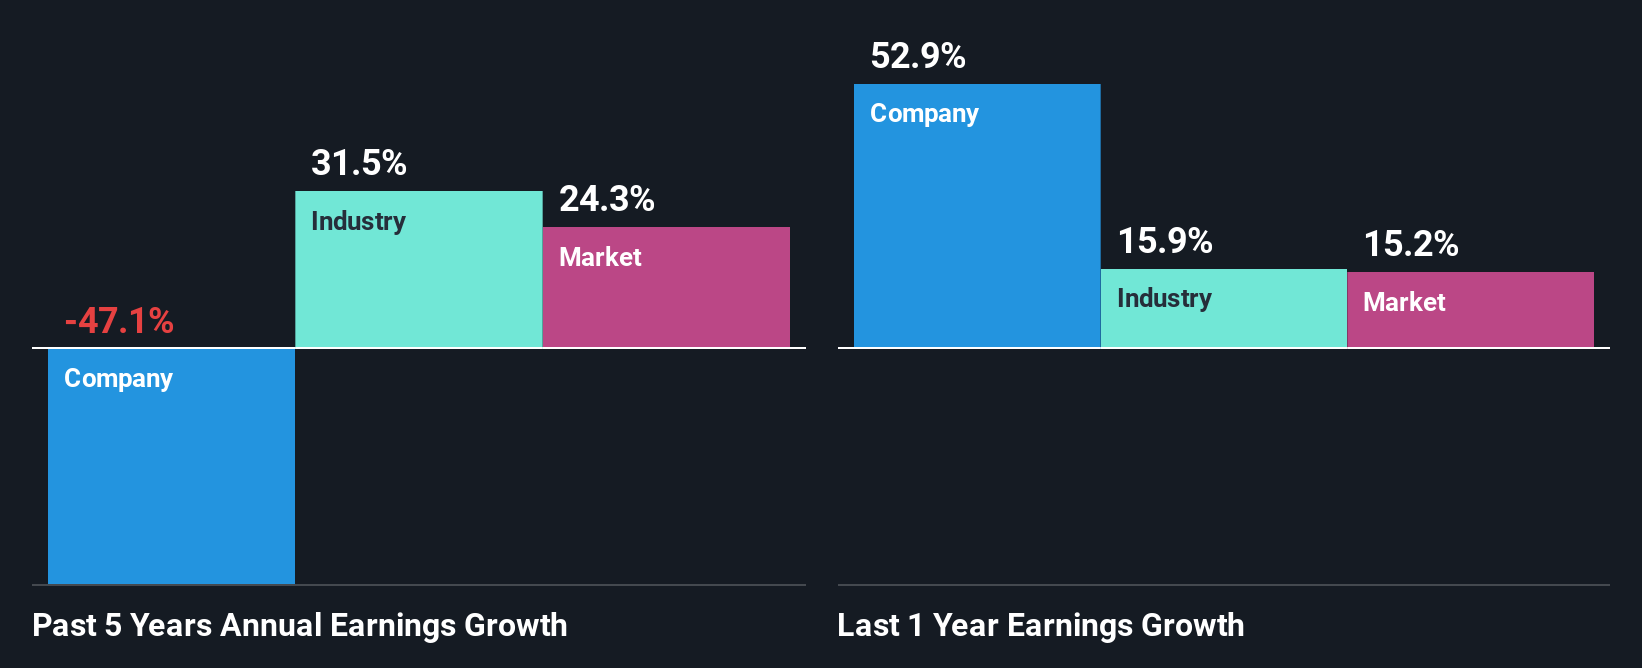
As you can see, Vakrangee's ROE looks pretty weak. Even compared to the average industry ROE of 5.6%, the company's ROE is quite dismal. For this reason, Vakrangee's five year net income decline of 47% is not surprising given its lower ROE. We reckon that there could also be other factors at play here. For example, the business has allocated capital poorly, or that the company has a very high payout ratio.
So, as a next step, we compared Vakrangee's performance against the industry and were disappointed to discover that while the company has been shrinking its earnings, the industry has been growing its earnings at a rate of 31% over the last few years.
Earnings growth is an important metric to consider when valuing a stock. The investor should try to establish if the expected growth or decline in earnings, whichever the case may be, is priced in. This then helps them determine if the stock is placed for a bright or bleak future. Is Vakrangee fairly valued compared to other companies? These 3 valuation measures might help you decide.
Is Vakrangee Using Its Retained Earnings Effectively?
Vakrangee's high three-year median payout ratio of 205% suggests that the company is depleting its resources to keep up its dividend payments, and this shows in its shrinking earnings. Its usually very hard to sustain dividend payments that are higher than reported profits. You can see the 3 risks we have identified for Vakrangee by visiting our risks dashboard for free on our platform here.
In addition, Vakrangee has been paying dividends over a period of at least ten years suggesting that keeping up dividend payments is way more important to the management even if it comes at the cost of business growth.
Summary
In total, we would have a hard think before deciding on any investment action concerning Vakrangee. Particularly, its ROE is a huge disappointment, not to mention its lack of proper reinvestment into the business. As a result its earnings growth has also been quite disappointing. Up till now, we've only made a short study of the company's growth data. So it may be worth checking this free detailed graph of Vakrangee's past earnings, as well as revenue and cash flows to get a deeper insight into the company's performance.
New: Manage All Your Stock Portfolios in One Place
We've created the ultimate portfolio companion for stock investors, and it's free.
• Connect an unlimited number of Portfolios and see your total in one currency
• Be alerted to new Warning Signs or Risks via email or mobile
• Track the Fair Value of your stocks
Have feedback on this article? Concerned about the content? Get in touch with us directly. Alternatively, email editorial-team (at) simplywallst.com.
This article by Simply Wall St is general in nature. We provide commentary based on historical data and analyst forecasts only using an unbiased methodology and our articles are not intended to be financial advice. It does not constitute a recommendation to buy or sell any stock, and does not take account of your objectives, or your financial situation. We aim to bring you long-term focused analysis driven by fundamental data. Note that our analysis may not factor in the latest price-sensitive company announcements or qualitative material. Simply Wall St has no position in any stocks mentioned.
About NSEI:VAKRANGEE
Vakrangee
A technology company, provides e-commerce, white label ATM, financial, and logistics services in India.
Flawless balance sheet with proven track record.
Similar Companies
Market Insights

Advertisement
Community Narratives
The company that turned a verb into a global necessity and basically runs the modern internet, digital ads, smartphones, maps, and AI.
Fair Value US$300.00|7.1% undervalued
OS
Community Contributor
Flowers Foods Pays A Fair Price For Health
Fair Value US$16.12|26.4% undervalued
NV
Community Contributor
TMX Group will thrive with 33.3% profit margin and enduring market moat
Fair Value CA$49.90|0.8% overvalued
LI
Community Contributor
The "Molecular Pencil": Why Beam's Technology is Built to Win
Fair Value US$65.01|65.8% undervalued
DA
Community Contributor