

Warren Buffett famously said, 'Volatility is far from synonymous with risk.' It's only natural to consider a company's balance sheet when you examine how risky it is, since debt is often involved when a business collapses. Importantly, Trent Limited (NSE:TRENT) does carry debt. But the more important question is: how much risk is that debt creating?
When Is Debt Dangerous?
Debt assists a business until the business has trouble paying it off, either with new capital or with free cash flow. Part and parcel of capitalism is the process of 'creative destruction' where failed businesses are mercilessly liquidated by their bankers. However, a more common (but still painful) scenario is that it has to raise new equity capital at a low price, thus permanently diluting shareholders. Having said that, the most common situation is where a company manages its debt reasonably well - and to its own advantage. The first thing to do when considering how much debt a business uses is to look at its cash and debt together.
See our latest analysis for Trent
What Is Trent's Debt?
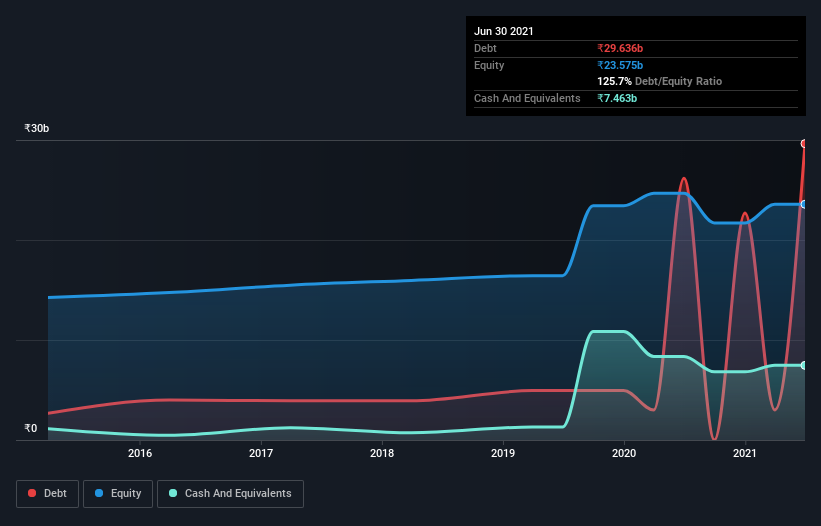
As you can see below, at the end of March 2021, Trent had ₹29.6b of debt, up from ₹26.2b a year ago. Click the image for more detail. On the flip side, it has ₹7.46b in cash leading to net debt of about ₹22.2b.
How Healthy Is Trent's Balance Sheet?
The latest balance sheet data shows that Trent had liabilities of ₹7.51b due within a year, and liabilities of ₹26.1b falling due after that. Offsetting these obligations, it had cash of ₹7.46b as well as receivables valued at ₹1.35b due within 12 months. So it has liabilities totalling ₹24.8b more than its cash and near-term receivables, combined.
Since publicly traded Trent shares are worth a total of ₹356.5b, it seems unlikely that this level of liabilities would be a major threat. Having said that, it's clear that we should continue to monitor its balance sheet, lest it change for the worse. There's no doubt that we learn most about debt from the balance sheet. But it is future earnings, more than anything, that will determine Trent's ability to maintain a healthy balance sheet going forward. So if you're focused on the future you can check out this free report showing analyst profit forecasts.
In the last year Trent had a loss before interest and tax, and actually shrunk its revenue by 3.3%, to ₹28b. That's not what we would hope to see.
Caveat Emptor
Importantly, Trent had an earnings before interest and tax (EBIT) loss over the last year. To be specific the EBIT loss came in at ₹71m. Considering that alongside the liabilities mentioned above does not give us much confidence that company should be using so much debt. Quite frankly we think the balance sheet is far from match-fit, although it could be improved with time. We would feel better if it turned its trailing twelve month loss of ₹952m into a profit. So we do think this stock is quite risky. The balance sheet is clearly the area to focus on when you are analysing debt. However, not all investment risk resides within the balance sheet - far from it. For example - Trent has 1 warning sign we think you should be aware of.
If, after all that, you're more interested in a fast growing company with a rock-solid balance sheet, then check out our list of net cash growth stocks without delay.
If you decide to trade Trent, use the lowest-cost* platform that is rated #1 Overall by Barron’s, Interactive Brokers. Trade stocks, options, futures, forex, bonds and funds on 135 markets, all from a single integrated account. Promoted
Valuation is complex, but we're here to simplify it.
Discover if Trent might be undervalued or overvalued with our detailed analysis, featuring fair value estimates, potential risks, dividends, insider trades, and its financial condition.
Access Free AnalysisThis article by Simply Wall St is general in nature. We provide commentary based on historical data and analyst forecasts only using an unbiased methodology and our articles are not intended to be financial advice. It does not constitute a recommendation to buy or sell any stock, and does not take account of your objectives, or your financial situation. We aim to bring you long-term focused analysis driven by fundamental data. Note that our analysis may not factor in the latest price-sensitive company announcements or qualitative material. Simply Wall St has no position in any stocks mentioned.
*Interactive Brokers Rated Lowest Cost Broker by StockBrokers.com Annual Online Review 2020
Have feedback on this article? Concerned about the content? Get in touch with us directly. Alternatively, email editorial-team (at) simplywallst.com.
About NSEI:TRENT
Trent
Engages in the retailing and trading of apparels, footwear, accessories, toys, games, and other products in India.
Exceptional growth potential with flawless balance sheet.
