- India
- /
- Specialty Stores
- /
- NSEI:TRENT
These 4 Measures Indicate That Trent (NSE:TRENT) Is Using Debt Extensively


Warren Buffett famously said, 'Volatility is far from synonymous with risk.' So it seems the smart money knows that debt - which is usually involved in bankruptcies - is a very important factor, when you assess how risky a company is. As with many other companies Trent Limited (NSE:TRENT) makes use of debt. But should shareholders be worried about its use of debt?
When Is Debt A Problem?
Generally speaking, debt only becomes a real problem when a company can't easily pay it off, either by raising capital or with its own cash flow. Ultimately, if the company can't fulfill its legal obligations to repay debt, shareholders could walk away with nothing. However, a more common (but still painful) scenario is that it has to raise new equity capital at a low price, thus permanently diluting shareholders. Of course, plenty of companies use debt to fund growth, without any negative consequences. The first step when considering a company's debt levels is to consider its cash and debt together.
View our latest analysis for Trent
How Much Debt Does Trent Carry?
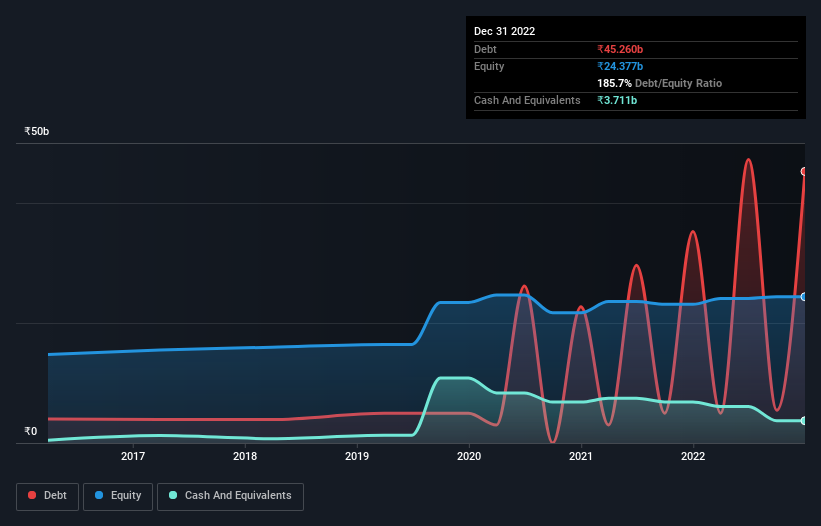
As you can see below, at the end of September 2022, Trent had ₹45.3b of debt, up from ₹35.2b a year ago. Click the image for more detail. On the flip side, it has ₹3.71b in cash leading to net debt of about ₹41.5b.
How Healthy Is Trent's Balance Sheet?
The latest balance sheet data shows that Trent had liabilities of ₹9.04b due within a year, and liabilities of ₹43.9b falling due after that. Offsetting these obligations, it had cash of ₹3.71b as well as receivables valued at ₹530.5m due within 12 months. So it has liabilities totalling ₹48.7b more than its cash and near-term receivables, combined.
Given Trent has a market capitalization of ₹477.0b, it's hard to believe these liabilities pose much threat. Having said that, it's clear that we should continue to monitor its balance sheet, lest it change for the worse.
We measure a company's debt load relative to its earnings power by looking at its net debt divided by its earnings before interest, tax, depreciation, and amortization (EBITDA) and by calculating how easily its earnings before interest and tax (EBIT) cover its interest expense (interest cover). Thus we consider debt relative to earnings both with and without depreciation and amortization expenses.
Trent shareholders face the double whammy of a high net debt to EBITDA ratio (6.1), and fairly weak interest coverage, since EBIT is just 1.8 times the interest expense. The debt burden here is substantial. However, it should be some comfort for shareholders to recall that Trent actually grew its EBIT by a hefty 120%, over the last 12 months. If it can keep walking that path it will be in a position to shed its debt with relative ease. There's no doubt that we learn most about debt from the balance sheet. But it is future earnings, more than anything, that will determine Trent's ability to maintain a healthy balance sheet going forward. So if you're focused on the future you can check out this free report showing analyst profit forecasts.
Finally, while the tax-man may adore accounting profits, lenders only accept cold hard cash. So the logical step is to look at the proportion of that EBIT that is matched by actual free cash flow. Over the last two years, Trent saw substantial negative free cash flow, in total. While that may be a result of expenditure for growth, it does make the debt far more risky.
Our View
Neither Trent's ability to convert EBIT to free cash flow nor its net debt to EBITDA gave us confidence in its ability to take on more debt. But its EBIT growth rate tells a very different story, and suggests some resilience. We think that Trent's debt does make it a bit risky, after considering the aforementioned data points together. That's not necessarily a bad thing, since leverage can boost returns on equity, but it is something to be aware of. There's no doubt that we learn most about debt from the balance sheet. However, not all investment risk resides within the balance sheet - far from it. Be aware that Trent is showing 1 warning sign in our investment analysis , you should know about...
If, after all that, you're more interested in a fast growing company with a rock-solid balance sheet, then check out our list of net cash growth stocks without delay.
Valuation is complex, but we're here to simplify it.
Discover if Trent might be undervalued or overvalued with our detailed analysis, featuring fair value estimates, potential risks, dividends, insider trades, and its financial condition.
Access Free AnalysisHave feedback on this article? Concerned about the content? Get in touch with us directly. Alternatively, email editorial-team (at) simplywallst.com.
This article by Simply Wall St is general in nature. We provide commentary based on historical data and analyst forecasts only using an unbiased methodology and our articles are not intended to be financial advice. It does not constitute a recommendation to buy or sell any stock, and does not take account of your objectives, or your financial situation. We aim to bring you long-term focused analysis driven by fundamental data. Note that our analysis may not factor in the latest price-sensitive company announcements or qualitative material. Simply Wall St has no position in any stocks mentioned.
About NSEI:TRENT
Trent
Engages in the retailing and trading of apparels, footwear, accessories, toys, games, and other products in India.
Exceptional growth potential with flawless balance sheet.
