

Howard Marks put it nicely when he said that, rather than worrying about share price volatility, 'The possibility of permanent loss is the risk I worry about... and every practical investor I know worries about.' It's only natural to consider a company's balance sheet when you examine how risky it is, since debt is often involved when a business collapses. We note that Trent Limited (NSE:TRENT) does have debt on its balance sheet. But should shareholders be worried about its use of debt?
When Is Debt Dangerous?
Debt is a tool to help businesses grow, but if a business is incapable of paying off its lenders, then it exists at their mercy. Part and parcel of capitalism is the process of 'creative destruction' where failed businesses are mercilessly liquidated by their bankers. However, a more common (but still painful) scenario is that it has to raise new equity capital at a low price, thus permanently diluting shareholders. Of course, debt can be an important tool in businesses, particularly capital heavy businesses. When we examine debt levels, we first consider both cash and debt levels, together.
Check out our latest analysis for Trent
What Is Trent's Net Debt?
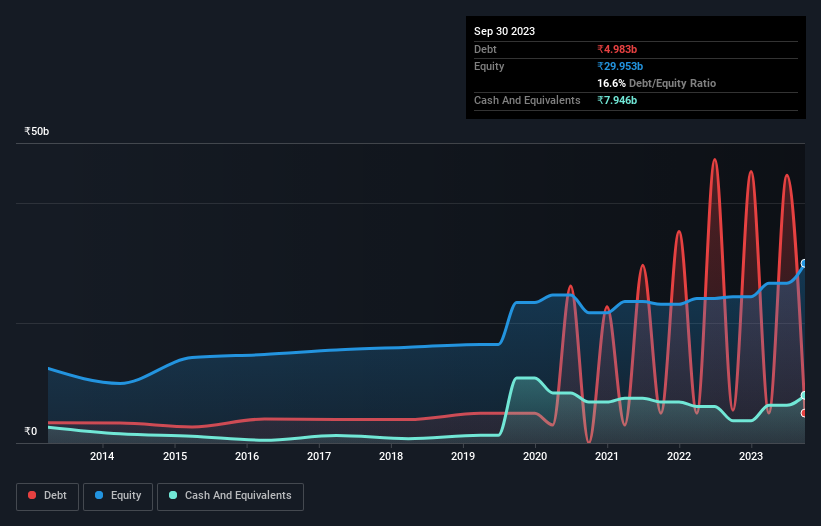
You can click the graphic below for the historical numbers, but it shows that Trent had ₹4.98b of debt in September 2023, down from ₹5.48b, one year before. But on the other hand it also has ₹7.95b in cash, leading to a ₹2.96b net cash position.
A Look At Trent's Liabilities
Zooming in on the latest balance sheet data, we can see that Trent had liabilities of ₹12.7b due within 12 months and liabilities of ₹46.7b due beyond that. On the other hand, it had cash of ₹7.95b and ₹698.1m worth of receivables due within a year. So it has liabilities totalling ₹50.8b more than its cash and near-term receivables, combined.
Of course, Trent has a titanic market capitalization of ₹949.0b, so these liabilities are probably manageable. Having said that, it's clear that we should continue to monitor its balance sheet, lest it change for the worse. Despite its noteworthy liabilities, Trent boasts net cash, so it's fair to say it does not have a heavy debt load!
Importantly, Trent grew its EBIT by 37% over the last twelve months, and that growth will make it easier to handle its debt. When analysing debt levels, the balance sheet is the obvious place to start. But it is future earnings, more than anything, that will determine Trent's ability to maintain a healthy balance sheet going forward. So if you're focused on the future you can check out this free report showing analyst profit forecasts.
Finally, while the tax-man may adore accounting profits, lenders only accept cold hard cash. Trent may have net cash on the balance sheet, but it is still interesting to look at how well the business converts its earnings before interest and tax (EBIT) to free cash flow, because that will influence both its need for, and its capacity to manage debt. In the last three years, Trent's free cash flow amounted to 30% of its EBIT, less than we'd expect. That's not great, when it comes to paying down debt.
Summing Up
We could understand if investors are concerned about Trent's liabilities, but we can be reassured by the fact it has has net cash of ₹2.96b. And it impressed us with its EBIT growth of 37% over the last year. So we are not troubled with Trent's debt use. There's no doubt that we learn most about debt from the balance sheet. However, not all investment risk resides within the balance sheet - far from it. For instance, we've identified 1 warning sign for Trent that you should be aware of.
When all is said and done, sometimes its easier to focus on companies that don't even need debt. Readers can access a list of growth stocks with zero net debt 100% free, right now.
Valuation is complex, but we're here to simplify it.
Discover if Trent might be undervalued or overvalued with our detailed analysis, featuring fair value estimates, potential risks, dividends, insider trades, and its financial condition.
Access Free AnalysisHave feedback on this article? Concerned about the content? Get in touch with us directly. Alternatively, email editorial-team (at) simplywallst.com.
This article by Simply Wall St is general in nature. We provide commentary based on historical data and analyst forecasts only using an unbiased methodology and our articles are not intended to be financial advice. It does not constitute a recommendation to buy or sell any stock, and does not take account of your objectives, or your financial situation. We aim to bring you long-term focused analysis driven by fundamental data. Note that our analysis may not factor in the latest price-sensitive company announcements or qualitative material. Simply Wall St has no position in any stocks mentioned.
About NSEI:TRENT
Trent
Engages in the retailing and trading of apparels, footwear, accessories, toys, games, and other products in India.
Exceptional growth potential with flawless balance sheet.

