

To find a multi-bagger stock, what are the underlying trends we should look for in a business? Ideally, a business will show two trends; firstly a growing return on capital employed (ROCE) and secondly, an increasing amount of capital employed. If you see this, it typically means it's a company with a great business model and plenty of profitable reinvestment opportunities. However, after investigating Trent (NSE:TRENT), we don't think it's current trends fit the mold of a multi-bagger.
Understanding Return On Capital Employed (ROCE)
Just to clarify if you're unsure, ROCE is a metric for evaluating how much pre-tax income (in percentage terms) a company earns on the capital invested in its business. The formula for this calculation on Trent is:
Return on Capital Employed = Earnings Before Interest and Tax (EBIT) ÷ (Total Assets - Current Liabilities)
0.037 = ₹2.6b ÷ (₹77b - ₹6.5b) (Based on the trailing twelve months to March 2022).
Therefore, Trent has an ROCE of 3.7%. In absolute terms, that's a low return and it also under-performs the Multiline Retail industry average of 5.1%.
Check out our latest analysis for Trent
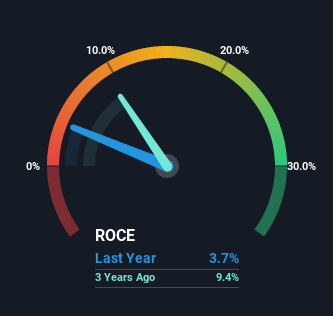
Above you can see how the current ROCE for Trent compares to its prior returns on capital, but there's only so much you can tell from the past. If you'd like, you can check out the forecasts from the analysts covering Trent here for free.
How Are Returns Trending?
On the surface, the trend of ROCE at Trent doesn't inspire confidence. Over the last five years, returns on capital have decreased to 3.7% from 5.4% five years ago. Although, given both revenue and the amount of assets employed in the business have increased, it could suggest the company is investing in growth, and the extra capital has led to a short-term reduction in ROCE. And if the increased capital generates additional returns, the business, and thus shareholders, will benefit in the long run.
On a side note, Trent has done well to pay down its current liabilities to 8.5% of total assets. That could partly explain why the ROCE has dropped. Effectively this means their suppliers or short-term creditors are funding less of the business, which reduces some elements of risk. Since the business is basically funding more of its operations with it's own money, you could argue this has made the business less efficient at generating ROCE.
Our Take On Trent's ROCE
Even though returns on capital have fallen in the short term, we find it promising that revenue and capital employed have both increased for Trent. And the stock has done incredibly well with a 383% return over the last five years, so long term investors are no doubt ecstatic with that result. So while the underlying trends could already be accounted for by investors, we still think this stock is worth looking into further.
While Trent doesn't shine too bright in this respect, it's still worth seeing if the company is trading at attractive prices. You can find that out with our FREE intrinsic value estimation on our platform.
While Trent may not currently earn the highest returns, we've compiled a list of companies that currently earn more than 25% return on equity. Check out this free list here.
Valuation is complex, but we're here to simplify it.
Discover if Trent might be undervalued or overvalued with our detailed analysis, featuring fair value estimates, potential risks, dividends, insider trades, and its financial condition.
Access Free AnalysisHave feedback on this article? Concerned about the content? Get in touch with us directly. Alternatively, email editorial-team (at) simplywallst.com.
This article by Simply Wall St is general in nature. We provide commentary based on historical data and analyst forecasts only using an unbiased methodology and our articles are not intended to be financial advice. It does not constitute a recommendation to buy or sell any stock, and does not take account of your objectives, or your financial situation. We aim to bring you long-term focused analysis driven by fundamental data. Note that our analysis may not factor in the latest price-sensitive company announcements or qualitative material. Simply Wall St has no position in any stocks mentioned.
About NSEI:TRENT
Trent
Engages in the retailing and trading of apparels, footwear, accessories, toys, games, and other products in India.
Exceptional growth potential with flawless balance sheet.
