Does This Valuation Of Alkem Laboratories Limited (NSE:ALKEM) Imply Investors Are Overpaying?


Today we will run through one way of estimating the intrinsic value of Alkem Laboratories Limited (NSE:ALKEM) by taking the forecast future cash flows of the company and discounting them back to today's value. We will use the Discounted Cash Flow (DCF) model on this occasion. It may sound complicated, but actually it is quite simple!
Companies can be valued in a lot of ways, so we would point out that a DCF is not perfect for every situation. If you want to learn more about discounted cash flow, the rationale behind this calculation can be read in detail in the Simply Wall St analysis model.
Check out our latest analysis for Alkem Laboratories
The calculation
We're using the 2-stage growth model, which simply means we take in account two stages of company's growth. In the initial period the company may have a higher growth rate and the second stage is usually assumed to have a stable growth rate. In the first stage we need to estimate the cash flows to the business over the next ten years. Where possible we use analyst estimates, but when these aren't available we extrapolate the previous free cash flow (FCF) from the last estimate or reported value. We assume companies with shrinking free cash flow will slow their rate of shrinkage, and that companies with growing free cash flow will see their growth rate slow, over this period. We do this to reflect that growth tends to slow more in the early years than it does in later years.
A DCF is all about the idea that a dollar in the future is less valuable than a dollar today, so we need to discount the sum of these future cash flows to arrive at a present value estimate:
10-year free cash flow (FCF) forecast
| 2022 | 2023 | 2024 | 2025 | 2026 | 2027 | 2028 | 2029 | 2030 | 2031 | |
| Levered FCF (₹, Millions) | ₹12.6b | ₹14.8b | ₹17.1b | ₹19.1b | ₹21.0b | ₹22.9b | ₹24.8b | ₹26.7b | ₹28.7b | ₹30.8b |
| Growth Rate Estimate Source | Analyst x11 | Analyst x12 | Analyst x8 | Est @ 11.46% | Est @ 10.04% | Est @ 9.05% | Est @ 8.36% | Est @ 7.87% | Est @ 7.53% | Est @ 7.3% |
| Present Value (₹, Millions) Discounted @ 12% | ₹11.3k | ₹11.8k | ₹12.3k | ₹12.2k | ₹12.0k | ₹11.8k | ₹11.4k | ₹11.0k | ₹10.6k | ₹10.2k |
("Est" = FCF growth rate estimated by Simply Wall St)
Present Value of 10-year Cash Flow (PVCF) = ₹115b
After calculating the present value of future cash flows in the initial 10-year period, we need to calculate the Terminal Value, which accounts for all future cash flows beyond the first stage. For a number of reasons a very conservative growth rate is used that cannot exceed that of a country's GDP growth. In this case we have used the 5-year average of the 10-year government bond yield (6.7%) to estimate future growth. In the same way as with the 10-year 'growth' period, we discount future cash flows to today's value, using a cost of equity of 12%.
Terminal Value (TV)= FCF2031 × (1 + g) ÷ (r – g) = ₹31b× (1 + 6.7%) ÷ (12%– 6.7%) = ₹660b
Present Value of Terminal Value (PVTV)= TV / (1 + r)10= ₹660b÷ ( 1 + 12%)10= ₹218b
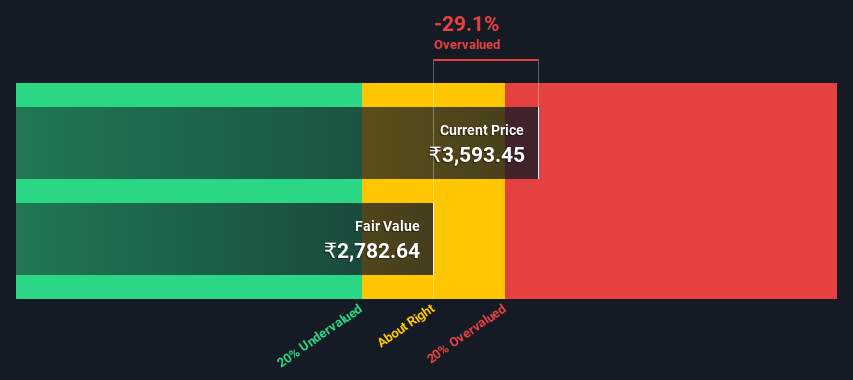
The total value, or equity value, is then the sum of the present value of the future cash flows, which in this case is ₹333b. To get the intrinsic value per share, we divide this by the total number of shares outstanding. Compared to the current share price of ₹3.6k, the company appears slightly overvalued at the time of writing. Valuations are imprecise instruments though, rather like a telescope - move a few degrees and end up in a different galaxy. Do keep this in mind.
Important assumptions
The calculation above is very dependent on two assumptions. The first is the discount rate and the other is the cash flows. If you don't agree with these result, have a go at the calculation yourself and play with the assumptions. The DCF also does not consider the possible cyclicality of an industry, or a company's future capital requirements, so it does not give a full picture of a company's potential performance. Given that we are looking at Alkem Laboratories as potential shareholders, the cost of equity is used as the discount rate, rather than the cost of capital (or weighted average cost of capital, WACC) which accounts for debt. In this calculation we've used 12%, which is based on a levered beta of 0.800. Beta is a measure of a stock's volatility, compared to the market as a whole. We get our beta from the industry average beta of globally comparable companies, with an imposed limit between 0.8 and 2.0, which is a reasonable range for a stable business.
Next Steps:
Whilst important, the DCF calculation shouldn't be the only metric you look at when researching a company. It's not possible to obtain a foolproof valuation with a DCF model. Preferably you'd apply different cases and assumptions and see how they would impact the company's valuation. For instance, if the terminal value growth rate is adjusted slightly, it can dramatically alter the overall result. What is the reason for the share price exceeding the intrinsic value? For Alkem Laboratories, we've compiled three important aspects you should explore:
- Risks: For example, we've discovered 2 warning signs for Alkem Laboratories that you should be aware of before investing here.
- Future Earnings: How does ALKEM's growth rate compare to its peers and the wider market? Dig deeper into the analyst consensus number for the upcoming years by interacting with our free analyst growth expectation chart.
- Other Solid Businesses: Low debt, high returns on equity and good past performance are fundamental to a strong business. Why not explore our interactive list of stocks with solid business fundamentals to see if there are other companies you may not have considered!
PS. Simply Wall St updates its DCF calculation for every Indian stock every day, so if you want to find the intrinsic value of any other stock just search here.
New: Manage All Your Stock Portfolios in One Place
We've created the ultimate portfolio companion for stock investors, and it's free.
• Connect an unlimited number of Portfolios and see your total in one currency
• Be alerted to new Warning Signs or Risks via email or mobile
• Track the Fair Value of your stocks
Have feedback on this article? Concerned about the content? Get in touch with us directly. Alternatively, email editorial-team (at) simplywallst.com.
This article by Simply Wall St is general in nature. We provide commentary based on historical data and analyst forecasts only using an unbiased methodology and our articles are not intended to be financial advice. It does not constitute a recommendation to buy or sell any stock, and does not take account of your objectives, or your financial situation. We aim to bring you long-term focused analysis driven by fundamental data. Note that our analysis may not factor in the latest price-sensitive company announcements or qualitative material. Simply Wall St has no position in any stocks mentioned.
About NSEI:ALKEM
Alkem Laboratories
A pharmaceutical company, engages in the research and development, manufacture, and sale of pharmaceutical and nutraceutical products in India, the United States, and internationally.
Flawless balance sheet with solid track record.

