
Advertisement
David Iben put it well when he said, 'Volatility is not a risk we care about. What we care about is avoiding the permanent loss of capital.' It's only natural to consider a company's balance sheet when you examine how risky it is, since debt is often involved when a business collapses. We note that S Chand and Company Limited (NSE:SCHAND) does have debt on its balance sheet. But is this debt a concern to shareholders?
What Risk Does Debt Bring?
Debt and other liabilities become risky for a business when it cannot easily fulfill those obligations, either with free cash flow or by raising capital at an attractive price. If things get really bad, the lenders can take control of the business. However, a more common (but still painful) scenario is that it has to raise new equity capital at a low price, thus permanently diluting shareholders. Having said that, the most common situation is where a company manages its debt reasonably well - and to its own advantage. When we think about a company's use of debt, we first look at cash and debt together.
Check out our latest analysis for S Chand
What Is S Chand's Debt?
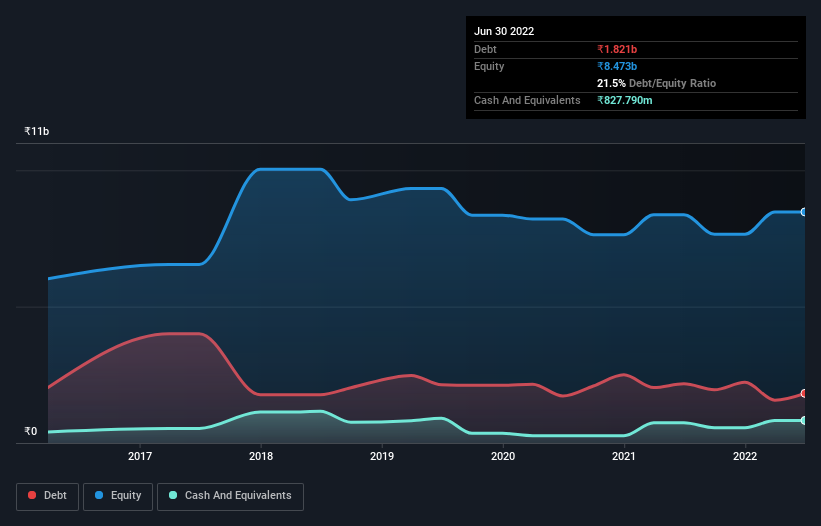
You can click the graphic below for the historical numbers, but it shows that S Chand had ₹1.82b of debt in March 2022, down from ₹2.17b, one year before. On the flip side, it has ₹827.8m in cash leading to net debt of about ₹993.3m.
How Strong Is S Chand's Balance Sheet?
We can see from the most recent balance sheet that S Chand had liabilities of ₹2.57b falling due within a year, and liabilities of ₹885.1m due beyond that. Offsetting these obligations, it had cash of ₹827.8m as well as receivables valued at ₹2.93b due within 12 months. So it can boast ₹301.3m more liquid assets than total liabilities.
This short term liquidity is a sign that S Chand could probably pay off its debt with ease, as its balance sheet is far from stretched.
In order to size up a company's debt relative to its earnings, we calculate its net debt divided by its earnings before interest, tax, depreciation, and amortization (EBITDA) and its earnings before interest and tax (EBIT) divided by its interest expense (its interest cover). This way, we consider both the absolute quantum of the debt, as well as the interest rates paid on it.
While S Chand's low debt to EBITDA ratio of 0.86 suggests only modest use of debt, the fact that EBIT only covered the interest expense by 2.8 times last year does give us pause. But the interest payments are certainly sufficient to have us thinking about how affordable its debt is. Notably, S Chand's EBIT launched higher than Elon Musk, gaining a whopping 1,001% on last year. The balance sheet is clearly the area to focus on when you are analysing debt. But it is future earnings, more than anything, that will determine S Chand's ability to maintain a healthy balance sheet going forward. So if you're focused on the future you can check out this free report showing analyst profit forecasts.
Finally, a business needs free cash flow to pay off debt; accounting profits just don't cut it. So the logical step is to look at the proportion of that EBIT that is matched by actual free cash flow. Over the last two years, S Chand actually produced more free cash flow than EBIT. There's nothing better than incoming cash when it comes to staying in your lenders' good graces.
Our View
Happily, S Chand's impressive conversion of EBIT to free cash flow implies it has the upper hand on its debt. But we must concede we find its interest cover has the opposite effect. Overall, we don't think S Chand is taking any bad risks, as its debt load seems modest. So we're not worried about the use of a little leverage on the balance sheet. There's no doubt that we learn most about debt from the balance sheet. But ultimately, every company can contain risks that exist outside of the balance sheet. For instance, we've identified 3 warning signs for S Chand (1 is significant) you should be aware of.
If you're interested in investing in businesses that can grow profits without the burden of debt, then check out this free list of growing businesses that have net cash on the balance sheet.
New: Manage All Your Stock Portfolios in One Place
We've created the ultimate portfolio companion for stock investors, and it's free.
• Connect an unlimited number of Portfolios and see your total in one currency
• Be alerted to new Warning Signs or Risks via email or mobile
• Track the Fair Value of your stocks
Have feedback on this article? Concerned about the content? Get in touch with us directly. Alternatively, email editorial-team (at) simplywallst.com.
This article by Simply Wall St is general in nature. We provide commentary based on historical data and analyst forecasts only using an unbiased methodology and our articles are not intended to be financial advice. It does not constitute a recommendation to buy or sell any stock, and does not take account of your objectives, or your financial situation. We aim to bring you long-term focused analysis driven by fundamental data. Note that our analysis may not factor in the latest price-sensitive company announcements or qualitative material. Simply Wall St has no position in any stocks mentioned.
About NSEI:SCHAND
S Chand
An education content company, engages in the publishing of books in India.
Flawless balance sheet, undervalued and pays a dividend.
Similar Companies
Market Insights

Advertisement
Community Narratives
The company that turned a verb into a global necessity and basically runs the modern internet, digital ads, smartphones, maps, and AI.
Fair Value US$300.00|7.1% undervalued
OS
Community Contributor
Flowers Foods Pays A Fair Price For Health
Fair Value US$16.12|26.4% undervalued
NV
Community Contributor
TMX Group will thrive with 33.3% profit margin and enduring market moat
Fair Value CA$49.90|0.8% overvalued
LI
Community Contributor
The "Molecular Pencil": Why Beam's Technology is Built to Win
Fair Value US$65.01|65.8% undervalued
DA
Community Contributor