Stock Analysis
- India
- /
- Entertainment
- /
- NSEI:SAREGAMA
Saregama India (NSE:SAREGAMA) stock performs better than its underlying earnings growth over last five years


For many, the main point of investing in the stock market is to achieve spectacular returns. And we've seen some truly amazing gains over the years. To wit, the Saregama India Limited (NSE:SAREGAMA) share price has soared 649% over five years. If that doesn't get you thinking about long term investing, we don't know what will. Also pleasing for shareholders was the 23% gain in the last three months. It really delights us to see such great share price performance for investors.
After a strong gain in the past week, it's worth seeing if longer term returns have been driven by improving fundamentals.
View our latest analysis for Saregama India
While the efficient markets hypothesis continues to be taught by some, it has been proven that markets are over-reactive dynamic systems, and investors are not always rational. One way to examine how market sentiment has changed over time is to look at the interaction between a company's share price and its earnings per share (EPS).
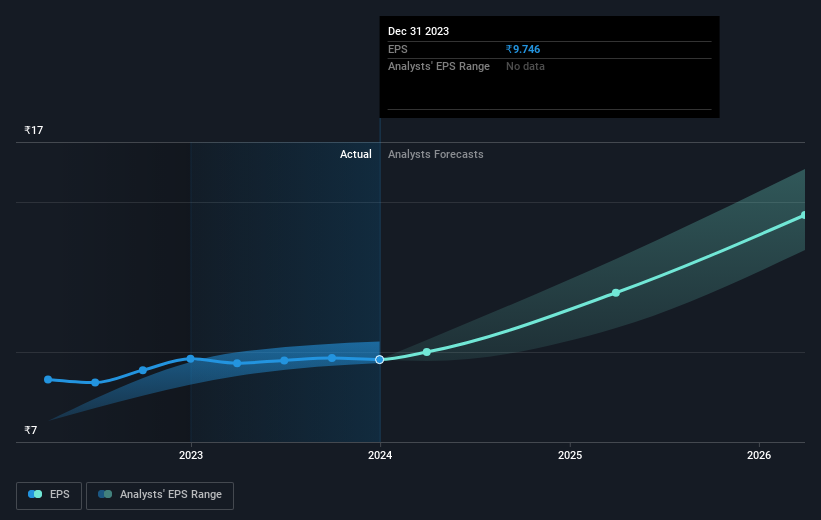
Over half a decade, Saregama India managed to grow its earnings per share at 26% a year. This EPS growth is slower than the share price growth of 50% per year, over the same period. This suggests that market participants hold the company in higher regard, these days. And that's hardly shocking given the track record of growth.
The graphic below depicts how EPS has changed over time (unveil the exact values by clicking on the image).
It might be well worthwhile taking a look at our free report on Saregama India's earnings, revenue and cash flow.
What About Dividends?
As well as measuring the share price return, investors should also consider the total shareholder return (TSR). The TSR incorporates the value of any spin-offs or discounted capital raisings, along with any dividends, based on the assumption that the dividends are reinvested. It's fair to say that the TSR gives a more complete picture for stocks that pay a dividend. As it happens, Saregama India's TSR for the last 5 years was 724%, which exceeds the share price return mentioned earlier. And there's no prize for guessing that the dividend payments largely explain the divergence!
A Different Perspective
Saregama India provided a TSR of 40% over the last twelve months. But that return falls short of the market. If we look back over five years, the returns are even better, coming in at 52% per year for five years. It's quite possible the business continues to execute with prowess, even as the share price gains are slowing. I find it very interesting to look at share price over the long term as a proxy for business performance. But to truly gain insight, we need to consider other information, too. Case in point: We've spotted 1 warning sign for Saregama India you should be aware of.
Of course, you might find a fantastic investment by looking elsewhere. So take a peek at this free list of companies we expect will grow earnings.
Please note, the market returns quoted in this article reflect the market weighted average returns of stocks that currently trade on Indian exchanges.
Valuation is complex, but we're helping make it simple.
Find out whether Saregama India is potentially over or undervalued by checking out our comprehensive analysis, which includes fair value estimates, risks and warnings, dividends, insider transactions and financial health.
View the Free AnalysisHave feedback on this article? Concerned about the content? Get in touch with us directly. Alternatively, email editorial-team (at) simplywallst.com.
This article by Simply Wall St is general in nature. We provide commentary based on historical data and analyst forecasts only using an unbiased methodology and our articles are not intended to be financial advice. It does not constitute a recommendation to buy or sell any stock, and does not take account of your objectives, or your financial situation. We aim to bring you long-term focused analysis driven by fundamental data. Note that our analysis may not factor in the latest price-sensitive company announcements or qualitative material. Simply Wall St has no position in any stocks mentioned.
About NSEI:SAREGAMA
Saregama India
Saregama India Limited operates as an entertainment company in India and internationally.
Flawless balance sheet with moderate growth potential.
