Is Shree Pushkar Chemicals & Fertilisers Limited's (NSE:SHREEPUSHK) P/E Ratio Really That Good?


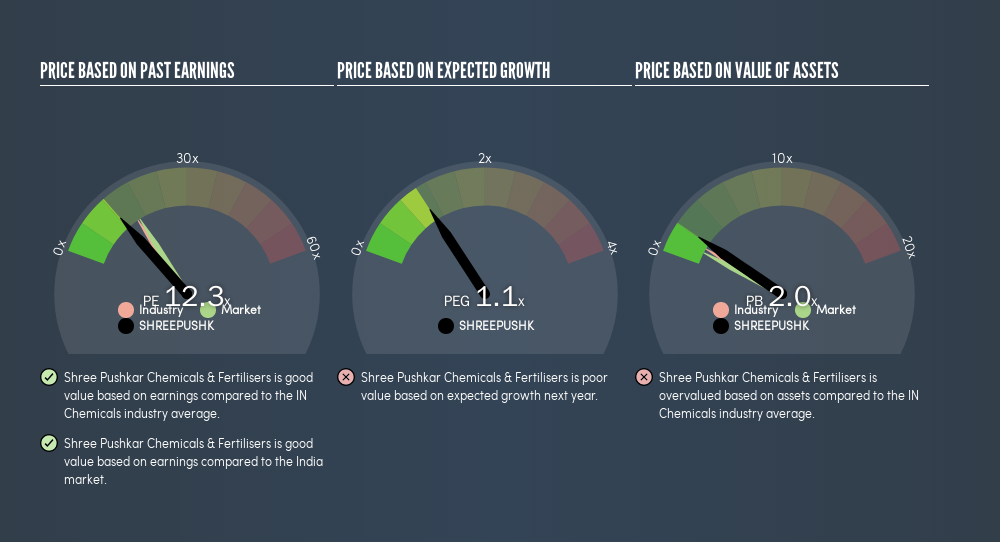
This article is for investors who would like to improve their understanding of price to earnings ratios (P/E ratios). We'll look at Shree Pushkar Chemicals & Fertilisers Limited's (NSE:SHREEPUSHK) P/E ratio and reflect on what it tells us about the company's share price. Shree Pushkar Chemicals & Fertilisers has a price to earnings ratio of 12.35, based on the last twelve months. In other words, at today's prices, investors are paying ₹12.35 for every ₹1 in prior year profit.
View our latest analysis for Shree Pushkar Chemicals & Fertilisers
How Do I Calculate A Price To Earnings Ratio?
The formula for price to earnings is:
Price to Earnings Ratio = Share Price ÷ Earnings per Share (EPS)
Or for Shree Pushkar Chemicals & Fertilisers:
P/E of 12.35 = ₹172.15 ÷ ₹13.94 (Based on the trailing twelve months to December 2018.)
Is A High Price-to-Earnings Ratio Good?
A higher P/E ratio implies that investors pay a higher price for the earning power of the business. That isn't a good or a bad thing on its own, but a high P/E means that buyers have a higher opinion of the business's prospects, relative to stocks with a lower P/E.
How Growth Rates Impact P/E Ratios
Probably the most important factor in determining what P/E a company trades on is the earnings growth. That's because companies that grow earnings per share quickly will rapidly increase the 'E' in the equation. That means even if the current P/E is high, it will reduce over time if the share price stays flat. So while a stock may look expensive based on past earnings, it could be cheap based on future earnings.
Most would be impressed by Shree Pushkar Chemicals & Fertilisers earnings growth of 19% in the last year. And earnings per share have improved by 15% annually, over the last five years. This could arguably justify a relatively high P/E ratio.
How Does Shree Pushkar Chemicals & Fertilisers's P/E Ratio Compare To Its Peers?
The P/E ratio essentially measures market expectations of a company. We can see in the image below that the average P/E (15.6) for companies in the chemicals industry is higher than Shree Pushkar Chemicals & Fertilisers's P/E.
This suggests that market participants think Shree Pushkar Chemicals & Fertilisers will underperform other companies in its industry. Since the market seems unimpressed with Shree Pushkar Chemicals & Fertilisers, it's quite possible it could surprise on the upside. You should delve deeper. I like to check if company insiders have been buying or selling.
Remember: P/E Ratios Don't Consider The Balance Sheet
The 'Price' in P/E reflects the market capitalization of the company. In other words, it does not consider any debt or cash that the company may have on the balance sheet. Theoretically, a business can improve its earnings (and produce a lower P/E in the future), by taking on debt (or spending its remaining cash).
Such spending might be good or bad, overall, but the key point here is that you need to look at debt to understand the P/E ratio in context.
Shree Pushkar Chemicals & Fertilisers's Balance Sheet
Shree Pushkar Chemicals & Fertilisers's net debt is 3.2% of its market cap. So it doesn't have as many options as it would with net cash, but its debt would not have much of an impact on its P/E ratio.
The Bottom Line On Shree Pushkar Chemicals & Fertilisers's P/E Ratio
Shree Pushkar Chemicals & Fertilisers has a P/E of 12.3. That's below the average in the IN market, which is 16.2. The EPS growth last year was strong, and debt levels are quite reasonable. If the company can continue to grow earnings, then the current P/E may be unjustifiably low. Since analysts are predicting growth will continue, one might expect to see a higher P/E so it may be worth looking closer.
Investors should be looking to buy stocks that the market is wrong about. As value investor Benjamin Graham famously said, 'In the short run, the market is a voting machine but in the long run, it is a weighing machine.' So this freevisual report on analyst forecasts could hold the key to an excellent investment decision.
Of course, you might find a fantastic investment by looking at a few good candidates. So take a peek at this freelist of companies with modest (or no) debt, trading on a P/E below 20.
We aim to bring you long-term focused research analysis driven by fundamental data. Note that our analysis may not factor in the latest price-sensitive company announcements or qualitative material.
If you spot an error that warrants correction, please contact the editor at editorial-team@simplywallst.com. This article by Simply Wall St is general in nature. It does not constitute a recommendation to buy or sell any stock, and does not take account of your objectives, or your financial situation. Simply Wall St has no position in the stocks mentioned. Thank you for reading.
About NSEI:SHREEPUSHK
Shree Pushkar Chemicals & Fertilisers
Manufactures and trades in chemicals, dyes and dyes intermediate, cattle feeds, fertilizers, and soil conditioners in India.
Solid track record with excellent balance sheet.

