Is Weakness In Sabar Flex India Limited (NSE:SABAR) Stock A Sign That The Market Could be Wrong Given Its Strong Financial Prospects?


Sabar Flex India (NSE:SABAR) has had a rough three months with its share price down 19%. However, stock prices are usually driven by a company’s financial performance over the long term, which in this case looks quite promising. Specifically, we decided to study Sabar Flex India's ROE in this article.
Return on equity or ROE is an important factor to be considered by a shareholder because it tells them how effectively their capital is being reinvested. Simply put, it is used to assess the profitability of a company in relation to its equity capital.
View our latest analysis for Sabar Flex India
How Do You Calculate Return On Equity?
The formula for ROE is:
Return on Equity = Net Profit (from continuing operations) ÷ Shareholders' Equity
So, based on the above formula, the ROE for Sabar Flex India is:
13% = ₹43m ÷ ₹325m (Based on the trailing twelve months to March 2024).
The 'return' refers to a company's earnings over the last year. Another way to think of that is that for every ₹1 worth of equity, the company was able to earn ₹0.13 in profit.
What Has ROE Got To Do With Earnings Growth?
Thus far, we have learned that ROE measures how efficiently a company is generating its profits. Depending on how much of these profits the company reinvests or "retains", and how effectively it does so, we are then able to assess a company’s earnings growth potential. Assuming everything else remains unchanged, the higher the ROE and profit retention, the higher the growth rate of a company compared to companies that don't necessarily bear these characteristics.
Sabar Flex India's Earnings Growth And 13% ROE
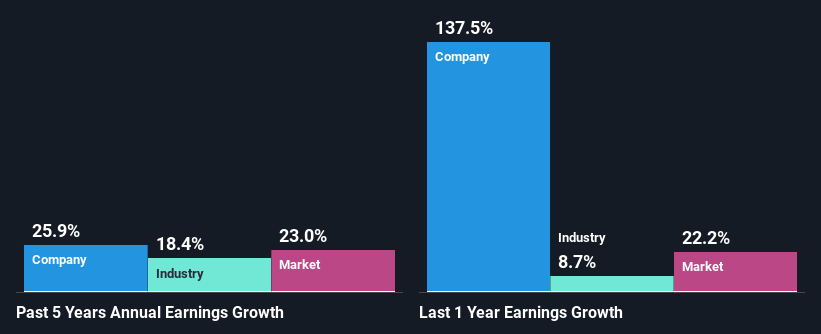
On the face of it, Sabar Flex India's ROE is not much to talk about. However, the fact that the its ROE is quite higher to the industry average of 10% doesn't go unnoticed by us. Even more so after seeing Sabar Flex India's exceptional 26% net income growth over the past five years. Bear in mind, the company does have a moderately low ROE. It is just that the industry ROE is lower. Hence, there might be some other aspects that are causing earnings to grow. Such as- high earnings retention or the company belonging to a high growth industry.
We then compared Sabar Flex India's net income growth with the industry and we're pleased to see that the company's growth figure is higher when compared with the industry which has a growth rate of 18% in the same 5-year period.
The basis for attaching value to a company is, to a great extent, tied to its earnings growth. The investor should try to establish if the expected growth or decline in earnings, whichever the case may be, is priced in. By doing so, they will have an idea if the stock is headed into clear blue waters or if swampy waters await. If you're wondering about Sabar Flex India's's valuation, check out this gauge of its price-to-earnings ratio, as compared to its industry.
Is Sabar Flex India Using Its Retained Earnings Effectively?
Given that Sabar Flex India doesn't pay any regular dividends to its shareholders, we infer that the company has been reinvesting all of its profits to grow its business.
Conclusion
In total, we are pretty happy with Sabar Flex India's performance. In particular, it's great to see that the company has seen significant growth in its earnings backed by a respectable ROE and a high reinvestment rate. If the company continues to grow its earnings the way it has, that could have a positive impact on its share price given how earnings per share influence long-term share prices. Not to forget, share price outcomes are also dependent on the potential risks a company may face. So it is important for investors to be aware of the risks involved in the business. Our risks dashboard would have the 4 risks we have identified for Sabar Flex India.
New: Manage All Your Stock Portfolios in One Place
We've created the ultimate portfolio companion for stock investors, and it's free.
• Connect an unlimited number of Portfolios and see your total in one currency
• Be alerted to new Warning Signs or Risks via email or mobile
• Track the Fair Value of your stocks
Have feedback on this article? Concerned about the content? Get in touch with us directly. Alternatively, email editorial-team (at) simplywallst.com.
This article by Simply Wall St is general in nature. We provide commentary based on historical data and analyst forecasts only using an unbiased methodology and our articles are not intended to be financial advice. It does not constitute a recommendation to buy or sell any stock, and does not take account of your objectives, or your financial situation. We aim to bring you long-term focused analysis driven by fundamental data. Note that our analysis may not factor in the latest price-sensitive company announcements or qualitative material. Simply Wall St has no position in any stocks mentioned.
About NSEI:SABAR
Sabar Flex India
Manufactures and trades in flexible packaging products in India.
Solid track record with adequate balance sheet.

