Polyplex (NSE:POLYPLEX) shareholders notch a 21% CAGR over 5 years, yet earnings have been shrinking


The main point of investing for the long term is to make money. Better yet, you'd like to see the share price move up more than the market average. But Polyplex Corporation Limited (NSE:POLYPLEX) has fallen short of that second goal, with a share price rise of 83% over five years, which is below the market return. Zooming in, the stock is actually down 27% in the last year.
Since the stock has added ₹2.8b to its market cap in the past week alone, let's see if underlying performance has been driving long-term returns.
View our latest analysis for Polyplex
To quote Buffett, 'Ships will sail around the world but the Flat Earth Society will flourish. There will continue to be wide discrepancies between price and value in the marketplace...' One way to examine how market sentiment has changed over time is to look at the interaction between a company's share price and its earnings per share (EPS).
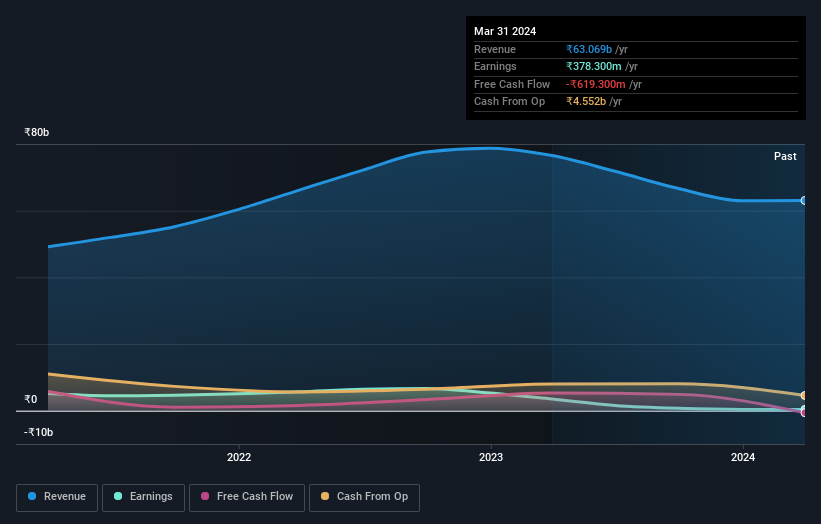
During five years of share price growth, Polyplex actually saw its EPS drop 35% per year.
This means it's unlikely the market is judging the company based on earnings growth. Since the change in EPS doesn't seem to correlate with the change in share price, it's worth taking a look at other metrics.
We doubt the modest 0.3% dividend yield is attracting many buyers to the stock. In contrast revenue growth of 11% per year is probably viewed as evidence that Polyplex is growing, a real positive. In that case, the company may be sacrificing current earnings per share to drive growth.
You can see how earnings and revenue have changed over time in the image below (click on the chart to see the exact values).
Take a more thorough look at Polyplex's financial health with this free report on its balance sheet.
What About Dividends?
As well as measuring the share price return, investors should also consider the total shareholder return (TSR). Whereas the share price return only reflects the change in the share price, the TSR includes the value of dividends (assuming they were reinvested) and the benefit of any discounted capital raising or spin-off. It's fair to say that the TSR gives a more complete picture for stocks that pay a dividend. As it happens, Polyplex's TSR for the last 5 years was 160%, which exceeds the share price return mentioned earlier. And there's no prize for guessing that the dividend payments largely explain the divergence!
A Different Perspective
Investors in Polyplex had a tough year, with a total loss of 27% (including dividends), against a market gain of about 46%. Even the share prices of good stocks drop sometimes, but we want to see improvements in the fundamental metrics of a business, before getting too interested. Longer term investors wouldn't be so upset, since they would have made 21%, each year, over five years. If the fundamental data continues to indicate long term sustainable growth, the current sell-off could be an opportunity worth considering. While it is well worth considering the different impacts that market conditions can have on the share price, there are other factors that are even more important. To that end, you should learn about the 3 warning signs we've spotted with Polyplex (including 1 which is significant) .
If you would prefer to check out another company -- one with potentially superior financials -- then do not miss this free list of companies that have proven they can grow earnings.
Please note, the market returns quoted in this article reflect the market weighted average returns of stocks that currently trade on Indian exchanges.
New: Manage All Your Stock Portfolios in One Place
We've created the ultimate portfolio companion for stock investors, and it's free.
• Connect an unlimited number of Portfolios and see your total in one currency
• Be alerted to new Warning Signs or Risks via email or mobile
• Track the Fair Value of your stocks
Have feedback on this article? Concerned about the content? Get in touch with us directly. Alternatively, email editorial-team (at) simplywallst.com.
This article by Simply Wall St is general in nature. We provide commentary based on historical data and analyst forecasts only using an unbiased methodology and our articles are not intended to be financial advice. It does not constitute a recommendation to buy or sell any stock, and does not take account of your objectives, or your financial situation. We aim to bring you long-term focused analysis driven by fundamental data. Note that our analysis may not factor in the latest price-sensitive company announcements or qualitative material. Simply Wall St has no position in any stocks mentioned.
Have feedback on this article? Concerned about the content? Get in touch with us directly. Alternatively, email editorial-team@simplywallst.com
About NSEI:POLYPLEX
Polyplex
Engages in the manufacture and sale of polyester (PET) films primarily for flexible packaging applications in India and internationally.
Flawless balance sheet second-rate dividend payer.

