
Advertisement
Could The Market Be Wrong About PCBL Limited (NSE:PCBL) Given Its Attractive Financial Prospects?
It is hard to get excited after looking at PCBL's (NSE:PCBL) recent performance, when its stock has declined 16% over the past three months. However, a closer look at its sound financials might cause you to think again. Given that fundamentals usually drive long-term market outcomes, the company is worth looking at. Particularly, we will be paying attention to PCBL's ROE today.
Return on Equity or ROE is a test of how effectively a company is growing its value and managing investors’ money. Put another way, it reveals the company's success at turning shareholder investments into profits.
Check out our latest analysis for PCBL
How To Calculate Return On Equity?
ROE can be calculated by using the formula:
Return on Equity = Net Profit (from continuing operations) ÷ Shareholders' Equity
So, based on the above formula, the ROE for PCBL is:
15% = ₹4.8b ÷ ₹31b (Based on the trailing twelve months to December 2023).
The 'return' is the amount earned after tax over the last twelve months. So, this means that for every ₹1 of its shareholder's investments, the company generates a profit of ₹0.15.
Why Is ROE Important For Earnings Growth?
We have already established that ROE serves as an efficient profit-generating gauge for a company's future earnings. Depending on how much of these profits the company reinvests or "retains", and how effectively it does so, we are then able to assess a company’s earnings growth potential. Generally speaking, other things being equal, firms with a high return on equity and profit retention, have a higher growth rate than firms that don’t share these attributes.
PCBL's Earnings Growth And 15% ROE
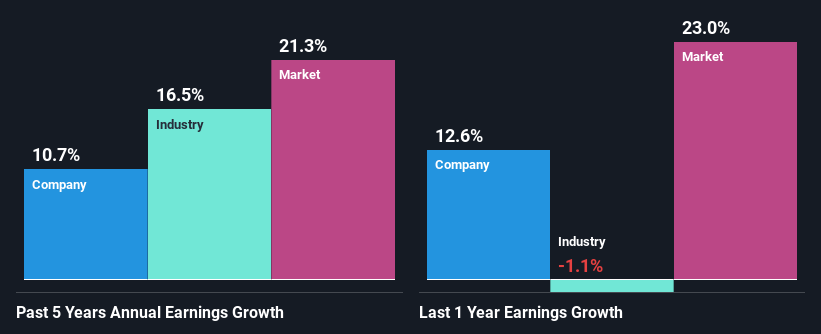
At first glance, PCBL seems to have a decent ROE. Further, the company's ROE compares quite favorably to the industry average of 11%. This certainly adds some context to PCBL's decent 11% net income growth seen over the past five years.
Next, on comparing with the industry net income growth, we found that PCBL's reported growth was lower than the industry growth of 17% over the last few years, which is not something we like to see.
Earnings growth is a huge factor in stock valuation. The investor should try to establish if the expected growth or decline in earnings, whichever the case may be, is priced in. This then helps them determine if the stock is placed for a bright or bleak future. What is PCBL worth today? The intrinsic value infographic in our free research report helps visualize whether PCBL is currently mispriced by the market.
Is PCBL Using Its Retained Earnings Effectively?
With a three-year median payout ratio of 45% (implying that the company retains 55% of its profits), it seems that PCBL is reinvesting efficiently in a way that it sees respectable amount growth in its earnings and pays a dividend that's well covered.
Besides, PCBL has been paying dividends for at least ten years or more. This shows that the company is committed to sharing profits with its shareholders. Existing analyst estimates suggest that the company's future payout ratio is expected to drop to 8.7% over the next three years. Despite the lower expected payout ratio, the company's ROE is not expected to change by much.
Conclusion
On the whole, we feel that PCBL's performance has been quite good. Specifically, we like that the company is reinvesting a huge chunk of its profits at a high rate of return. This of course has caused the company to see a good amount of growth in its earnings. Having said that, looking at the current analyst estimates, we found that the company's earnings are expected to gain momentum. To know more about the latest analysts predictions for the company, check out this visualization of analyst forecasts for the company.
New: Manage All Your Stock Portfolios in One Place
We've created the ultimate portfolio companion for stock investors, and it's free.
• Connect an unlimited number of Portfolios and see your total in one currency
• Be alerted to new Warning Signs or Risks via email or mobile
• Track the Fair Value of your stocks
Have feedback on this article? Concerned about the content? Get in touch with us directly. Alternatively, email editorial-team (at) simplywallst.com.
This article by Simply Wall St is general in nature. We provide commentary based on historical data and analyst forecasts only using an unbiased methodology and our articles are not intended to be financial advice. It does not constitute a recommendation to buy or sell any stock, and does not take account of your objectives, or your financial situation. We aim to bring you long-term focused analysis driven by fundamental data. Note that our analysis may not factor in the latest price-sensitive company announcements or qualitative material. Simply Wall St has no position in any stocks mentioned.
About NSEI:PCBL
PCBL Chemical
Together with subsidiaries, produces, sells, and exports carbon black in India and internationally.
6 star dividend payer with reasonable growth potential.
Similar Companies
Market Insights

Advertisement
Community Narratives
MINISO's fair value is projected at 26.69 with an anticipated PE ratio shift of 20x
Fair Value US$24.03|9.0% undervalued
BE
Community Contributor
Procter & Gamble: A Dividend Giant Facing Slowing Growth
Fair Value US$119.81|23.5% overvalued
AN
Community Contributor
Eli Lilly's Future Growth Driven by Tirzepatide and Favorable Market Conditions
Fair Value US$1.19k|14.4% undervalued
EA
Community Contributor