Stock Analysis
- India
- /
- Metals and Mining
- /
- NSEI:MMFL
M M Forgings' (NSE:MMFL) 31% YoY earnings expansion surpassed the shareholder returns over the past three years

It might seem bad, but the worst that can happen when you buy a stock (without leverage) is that its share price goes to zero. But when you pick a company that is really flourishing, you can make more than 100%. For instance the M M Forgings Limited (NSE:MMFL) share price is 115% higher than it was three years ago. How nice for those who held the stock! It's also up 12% in about a month.
Since it's been a strong week for M M Forgings shareholders, let's have a look at trend of the longer term fundamentals.
View our latest analysis for M M Forgings
While the efficient markets hypothesis continues to be taught by some, it has been proven that markets are over-reactive dynamic systems, and investors are not always rational. One flawed but reasonable way to assess how sentiment around a company has changed is to compare the earnings per share (EPS) with the share price.
M M Forgings was able to grow its EPS at 123% per year over three years, sending the share price higher. This EPS growth is higher than the 29% average annual increase in the share price. So one could reasonably conclude that the market has cooled on the stock.
The graphic below depicts how EPS has changed over time (unveil the exact values by clicking on the image).
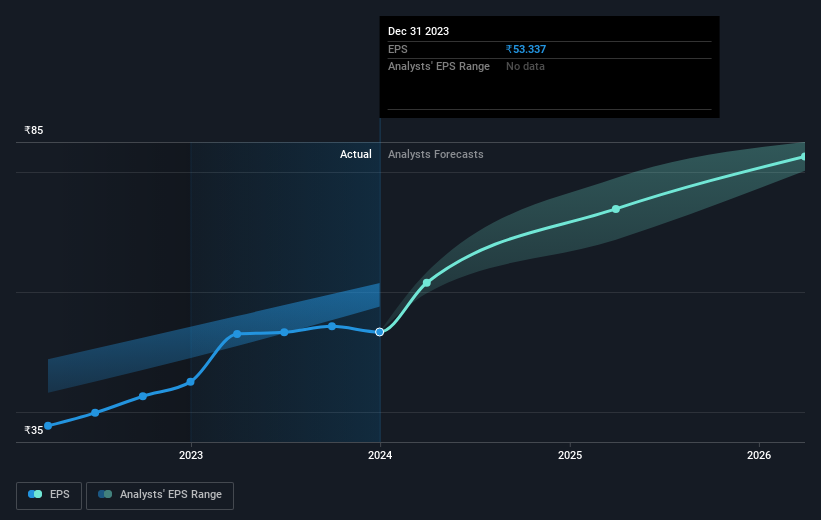
It is of course excellent to see how M M Forgings has grown profits over the years, but the future is more important for shareholders. You can see how its balance sheet has strengthened (or weakened) over time in this free interactive graphic.
What About Dividends?
As well as measuring the share price return, investors should also consider the total shareholder return (TSR). Whereas the share price return only reflects the change in the share price, the TSR includes the value of dividends (assuming they were reinvested) and the benefit of any discounted capital raising or spin-off. Arguably, the TSR gives a more comprehensive picture of the return generated by a stock. In the case of M M Forgings, it has a TSR of 120% for the last 3 years. That exceeds its share price return that we previously mentioned. And there's no prize for guessing that the dividend payments largely explain the divergence!
A Different Perspective
M M Forgings provided a TSR of 18% over the last twelve months. But that was short of the market average. The silver lining is that the gain was actually better than the average annual return of 13% per year over five year. It is possible that returns will improve along with the business fundamentals. I find it very interesting to look at share price over the long term as a proxy for business performance. But to truly gain insight, we need to consider other information, too. Case in point: We've spotted 2 warning signs for M M Forgings you should be aware of.
Of course, you might find a fantastic investment by looking elsewhere. So take a peek at this free list of companies we expect will grow earnings.
Please note, the market returns quoted in this article reflect the market weighted average returns of stocks that currently trade on Indian exchanges.
Valuation is complex, but we're helping make it simple.
Find out whether M M Forgings is potentially over or undervalued by checking out our comprehensive analysis, which includes fair value estimates, risks and warnings, dividends, insider transactions and financial health.
View the Free AnalysisHave feedback on this article? Concerned about the content? Get in touch with us directly. Alternatively, email editorial-team (at) simplywallst.com.
This article by Simply Wall St is general in nature. We provide commentary based on historical data and analyst forecasts only using an unbiased methodology and our articles are not intended to be financial advice. It does not constitute a recommendation to buy or sell any stock, and does not take account of your objectives, or your financial situation. We aim to bring you long-term focused analysis driven by fundamental data. Note that our analysis may not factor in the latest price-sensitive company announcements or qualitative material. Simply Wall St has no position in any stocks mentioned.
About NSEI:MMFL
M M Forgings
M M Forgings Limited, together with its subsidiaries, designs, manufactures, and sells steel forgings for passenger cars, commercial vehicles, off highway, agricultural, and high-pressure valves in India.
Excellent balance sheet and good value.
