Stock Analysis
- India
- /
- Metals and Mining
- /
- NSEI:JAIBALAJI
Is Jai Balaji Industries Limited's (NSE:JAIBALAJI) Recent Stock Performance Tethered To Its Strong Fundamentals?


Most readers would already be aware that Jai Balaji Industries' (NSE:JAIBALAJI) stock increased significantly by 15% over the past month. Since the market usually pay for a company’s long-term fundamentals, we decided to study the company’s key performance indicators to see if they could be influencing the market. Specifically, we decided to study Jai Balaji Industries' ROE in this article.
Return on equity or ROE is an important factor to be considered by a shareholder because it tells them how effectively their capital is being reinvested. Simply put, it is used to assess the profitability of a company in relation to its equity capital.
Check out our latest analysis for Jai Balaji Industries
How Do You Calculate Return On Equity?
Return on equity can be calculated by using the formula:
Return on Equity = Net Profit (from continuing operations) ÷ Shareholders' Equity
So, based on the above formula, the ROE for Jai Balaji Industries is:
60% = ₹5.9b ÷ ₹9.9b (Based on the trailing twelve months to December 2023).
The 'return' is the yearly profit. That means that for every ₹1 worth of shareholders' equity, the company generated ₹0.60 in profit.
What Has ROE Got To Do With Earnings Growth?
So far, we've learned that ROE is a measure of a company's profitability. Based on how much of its profits the company chooses to reinvest or "retain", we are then able to evaluate a company's future ability to generate profits. Assuming everything else remains unchanged, the higher the ROE and profit retention, the higher the growth rate of a company compared to companies that don't necessarily bear these characteristics.
A Side By Side comparison of Jai Balaji Industries' Earnings Growth And 60% ROE
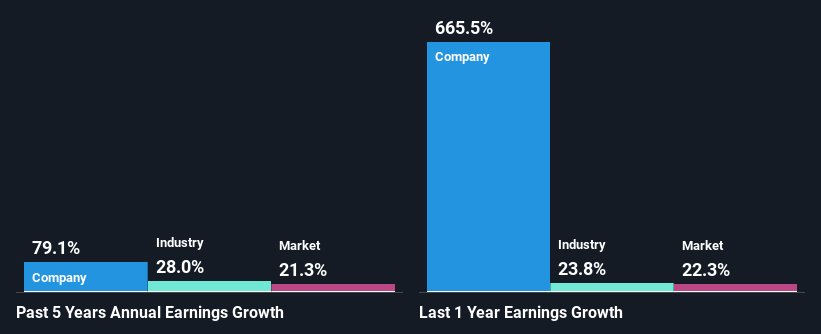
Firstly, we acknowledge that Jai Balaji Industries has a significantly high ROE. Secondly, even when compared to the industry average of 13% the company's ROE is quite impressive. So, the substantial 79% net income growth seen by Jai Balaji Industries over the past five years isn't overly surprising.
As a next step, we compared Jai Balaji Industries' net income growth with the industry, and pleasingly, we found that the growth seen by the company is higher than the average industry growth of 28%.
Earnings growth is an important metric to consider when valuing a stock. It’s important for an investor to know whether the market has priced in the company's expected earnings growth (or decline). Doing so will help them establish if the stock's future looks promising or ominous. If you're wondering about Jai Balaji Industries''s valuation, check out this gauge of its price-to-earnings ratio, as compared to its industry.
Is Jai Balaji Industries Making Efficient Use Of Its Profits?
Jai Balaji Industries doesn't pay any regular dividends currently which essentially means that it has been reinvesting all of its profits into the business. This definitely contributes to the high earnings growth number that we discussed above.
Conclusion
Overall, we are quite pleased with Jai Balaji Industries' performance. Particularly, we like that the company is reinvesting heavily into its business, and at a high rate of return. Unsurprisingly, this has led to an impressive earnings growth. If the company continues to grow its earnings the way it has, that could have a positive impact on its share price given how earnings per share influence long-term share prices. Not to forget, share price outcomes are also dependent on the potential risks a company may face. So it is important for investors to be aware of the risks involved in the business. To know the 2 risks we have identified for Jai Balaji Industries visit our risks dashboard for free.
Valuation is complex, but we're helping make it simple.
Find out whether Jai Balaji Industries is potentially over or undervalued by checking out our comprehensive analysis, which includes fair value estimates, risks and warnings, dividends, insider transactions and financial health.
View the Free AnalysisHave feedback on this article? Concerned about the content? Get in touch with us directly. Alternatively, email editorial-team (at) simplywallst.com.
This article by Simply Wall St is general in nature. We provide commentary based on historical data and analyst forecasts only using an unbiased methodology and our articles are not intended to be financial advice. It does not constitute a recommendation to buy or sell any stock, and does not take account of your objectives, or your financial situation. We aim to bring you long-term focused analysis driven by fundamental data. Note that our analysis may not factor in the latest price-sensitive company announcements or qualitative material. Simply Wall St has no position in any stocks mentioned.
About NSEI:JAIBALAJI
Jai Balaji Industries
Jai Balaji Industries Limited manufactures and markets iron and steel products primarily in India.
Flawless balance sheet with solid track record.
