The Returns On Capital At Dynemic Products (NSE:DYNPRO) Don't Inspire Confidence


If we want to find a stock that could multiply over the long term, what are the underlying trends we should look for? Firstly, we'd want to identify a growing return on capital employed (ROCE) and then alongside that, an ever-increasing base of capital employed. If you see this, it typically means it's a company with a great business model and plenty of profitable reinvestment opportunities. Although, when we looked at Dynemic Products (NSE:DYNPRO), it didn't seem to tick all of these boxes.
What Is Return On Capital Employed (ROCE)?
Just to clarify if you're unsure, ROCE is a metric for evaluating how much pre-tax income (in percentage terms) a company earns on the capital invested in its business. To calculate this metric for Dynemic Products, this is the formula:
Return on Capital Employed = Earnings Before Interest and Tax (EBIT) ÷ (Total Assets - Current Liabilities)
0.039 = ₹108m ÷ (₹4.3b - ₹1.5b) (Based on the trailing twelve months to December 2022).
So, Dynemic Products has an ROCE of 3.9%. Ultimately, that's a low return and it under-performs the Chemicals industry average of 17%.
View our latest analysis for Dynemic Products
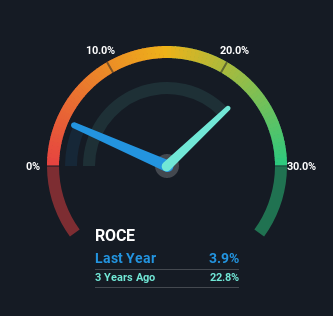
Historical performance is a great place to start when researching a stock so above you can see the gauge for Dynemic Products' ROCE against it's prior returns. If you'd like to look at how Dynemic Products has performed in the past in other metrics, you can view this free graph of past earnings, revenue and cash flow.
SWOT Analysis for Dynemic Products
- No major strengths identified for DYNPRO.
- Interest payments on debt are not well covered.
- Shareholders have been diluted in the past year.
- Has sufficient cash runway for more than 3 years based on current free cash flows.
- Lack of analyst coverage makes it difficult to determine DYNPRO's earnings prospects.
- Debt is not well covered by operating cash flow.
What Does the ROCE Trend For Dynemic Products Tell Us?
In terms of Dynemic Products' historical ROCE movements, the trend isn't fantastic. Over the last five years, returns on capital have decreased to 3.9% from 29% five years ago. Although, given both revenue and the amount of assets employed in the business have increased, it could suggest the company is investing in growth, and the extra capital has led to a short-term reduction in ROCE. If these investments prove successful, this can bode very well for long term stock performance.
What We Can Learn From Dynemic Products' ROCE
Even though returns on capital have fallen in the short term, we find it promising that revenue and capital employed have both increased for Dynemic Products. And the stock has followed suit returning a meaningful 61% to shareholders over the last five years. So while the underlying trends could already be accounted for by investors, we still think this stock is worth looking into further.
One final note, you should learn about the 5 warning signs we've spotted with Dynemic Products (including 2 which shouldn't be ignored) .
If you want to search for solid companies with great earnings, check out this free list of companies with good balance sheets and impressive returns on equity.
New: Manage All Your Stock Portfolios in One Place
We've created the ultimate portfolio companion for stock investors, and it's free.
• Connect an unlimited number of Portfolios and see your total in one currency
• Be alerted to new Warning Signs or Risks via email or mobile
• Track the Fair Value of your stocks
Have feedback on this article? Concerned about the content? Get in touch with us directly. Alternatively, email editorial-team (at) simplywallst.com.
This article by Simply Wall St is general in nature. We provide commentary based on historical data and analyst forecasts only using an unbiased methodology and our articles are not intended to be financial advice. It does not constitute a recommendation to buy or sell any stock, and does not take account of your objectives, or your financial situation. We aim to bring you long-term focused analysis driven by fundamental data. Note that our analysis may not factor in the latest price-sensitive company announcements or qualitative material. Simply Wall St has no position in any stocks mentioned.
About NSEI:DYNPRO
Dynemic Products
Engages in the manufacture and sale of dyes and dye intermediates in India.
Slight with questionable track record.
